Console documentation
Overview
This page is the complete documentation of the SEO4Ajax console. This documentation is divided into five main parts describing:
- the home page,
- the site status page,
- the site SEO reports page,
- the site dashboard page,
- the site settings page.
Home page
This page is the first page to be displayed when you're logged in. It allows:
- registering a new site in SEO4Ajax,
- viewing and configuring the registered sites,
- changing the account settings,
- managing your subscription.
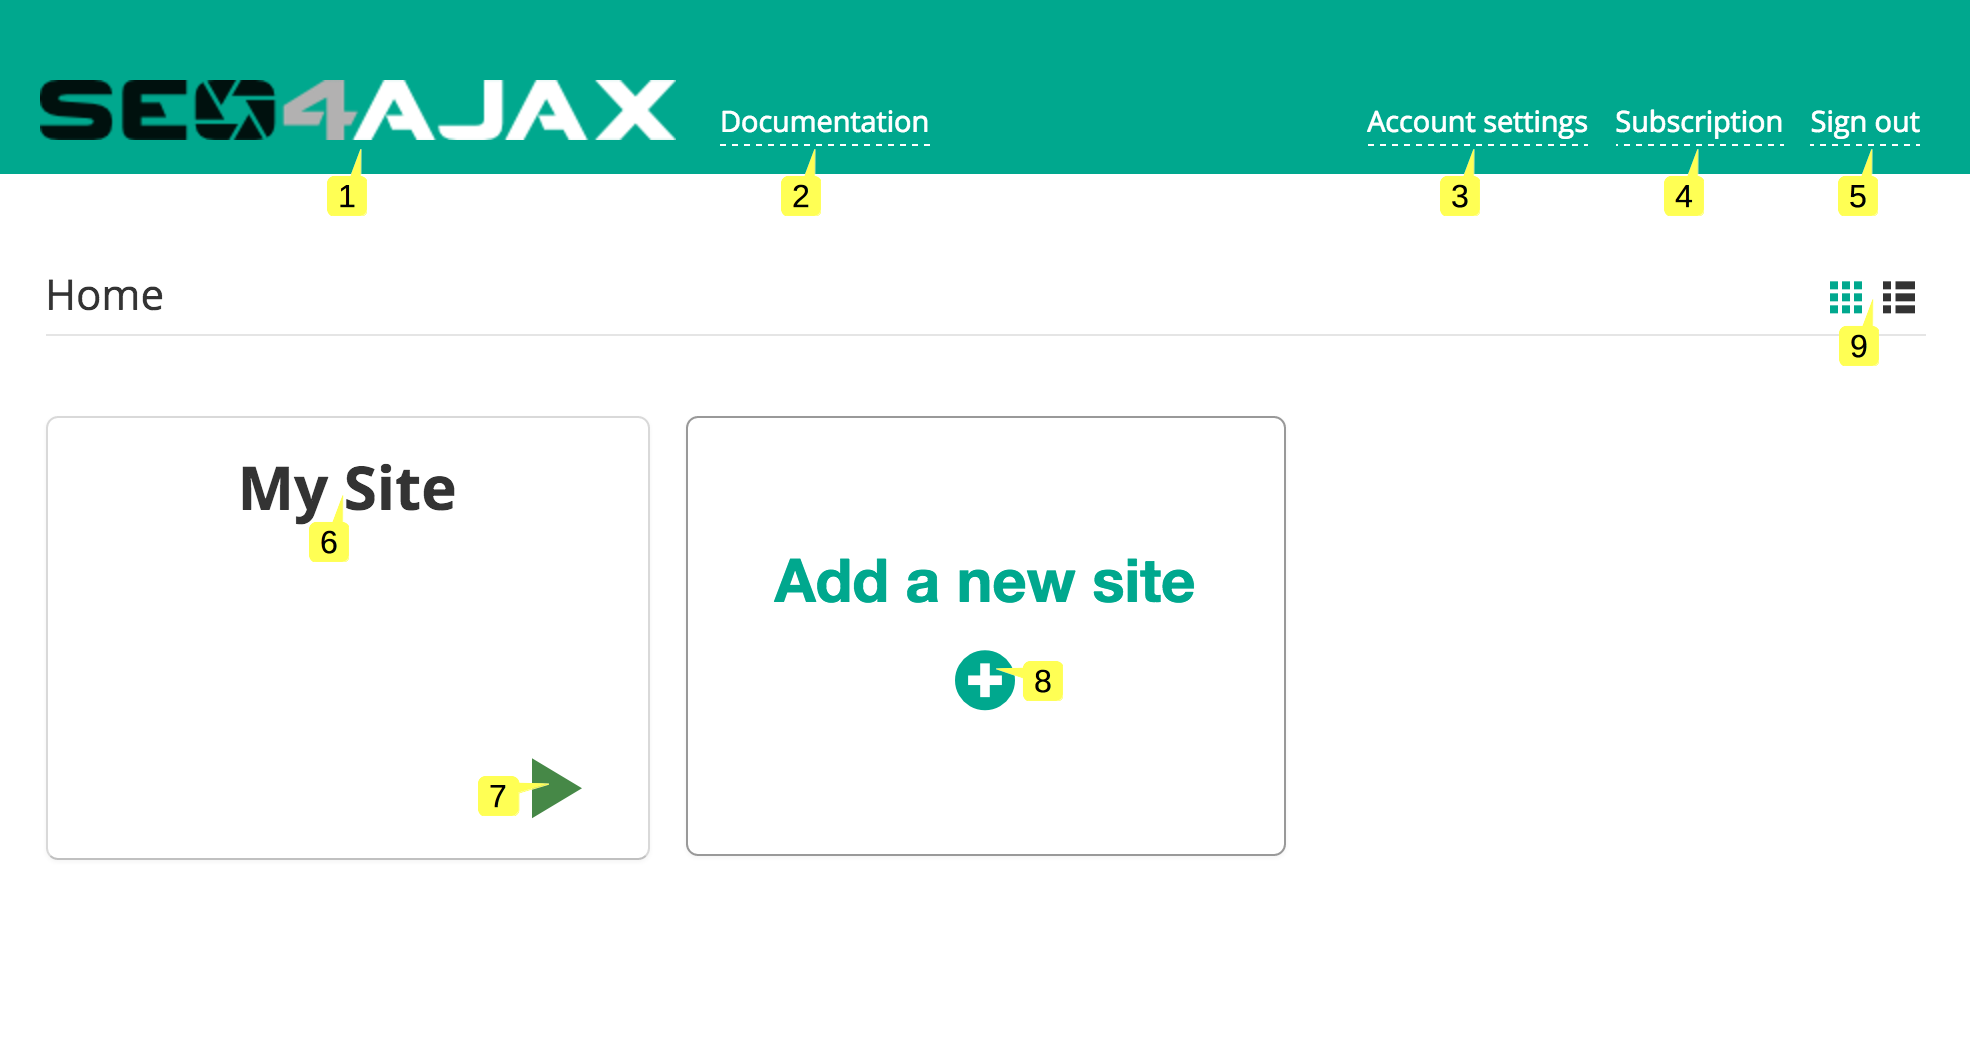
- At any time during the navigation, click on the SEO4Ajax logo 1 to go back to the home page
- Click on the "Documentation" link 2 to go to the index of the documentation
- Click on the "Account settings" link 3 to go to the Account settings page
- Click on the "Subscription" link 4 to go to the Subscription page
- Click on the "Sign out" link 5 to log out from the console
- Press one of the site button 6 to open the Site status page of the corresponding site
-
The status icon 7 shows the status of the crawler for the corresponding site. This status can be changed in the Site status page and has two states:
- the "play" icon means the crawler is active for this site
- the "pause" icon means the crawler is inactive
- Press the "Add a new site" button 8 to register a new site
- Click on the Grid/List icons 9 to switch from the grid view to the list view and vice-versa
New site registration
This popup is displayed when you press the "Add a new site" button in the Home page. It allows registering a new site in SEO4Ajax.
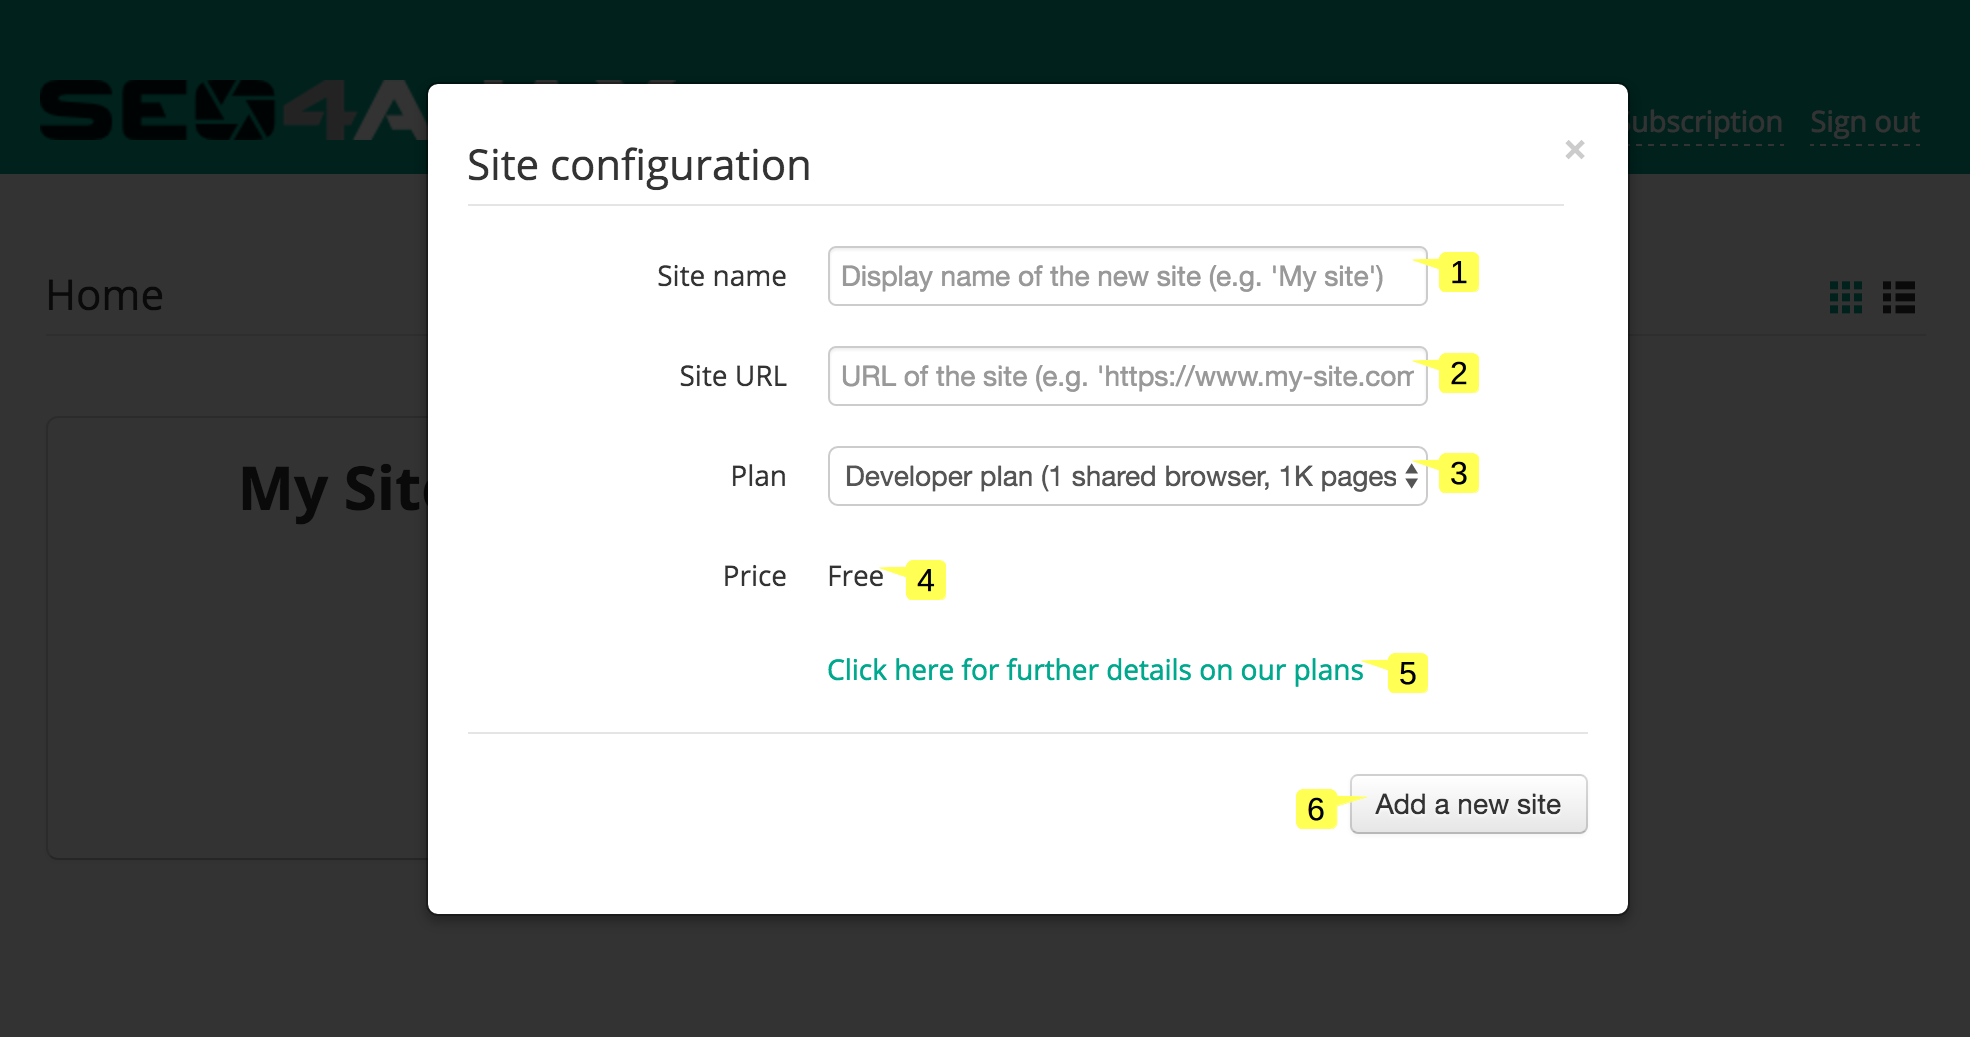
- Type a unique name for the site 1, this name will be displayed in the Home page and in the header of the Site status page
- Type the URL of the site 2
- Select a plan 3 if needed. The price of the selected plan is displayed below the input field 4
- Click on the link 5 to display the Pricing page
- Confirm the configuration by pressing the "Add a new site" button 6. Once the site added, the Site settings page is displayed in order to launch the first crawl
Credit card details popup
This popup is displayed when you press the "Add a new site" button in the Site configuration popup, and a paid plan has been selected but the credit card details have never been saved. The form allows registering your credit card details.
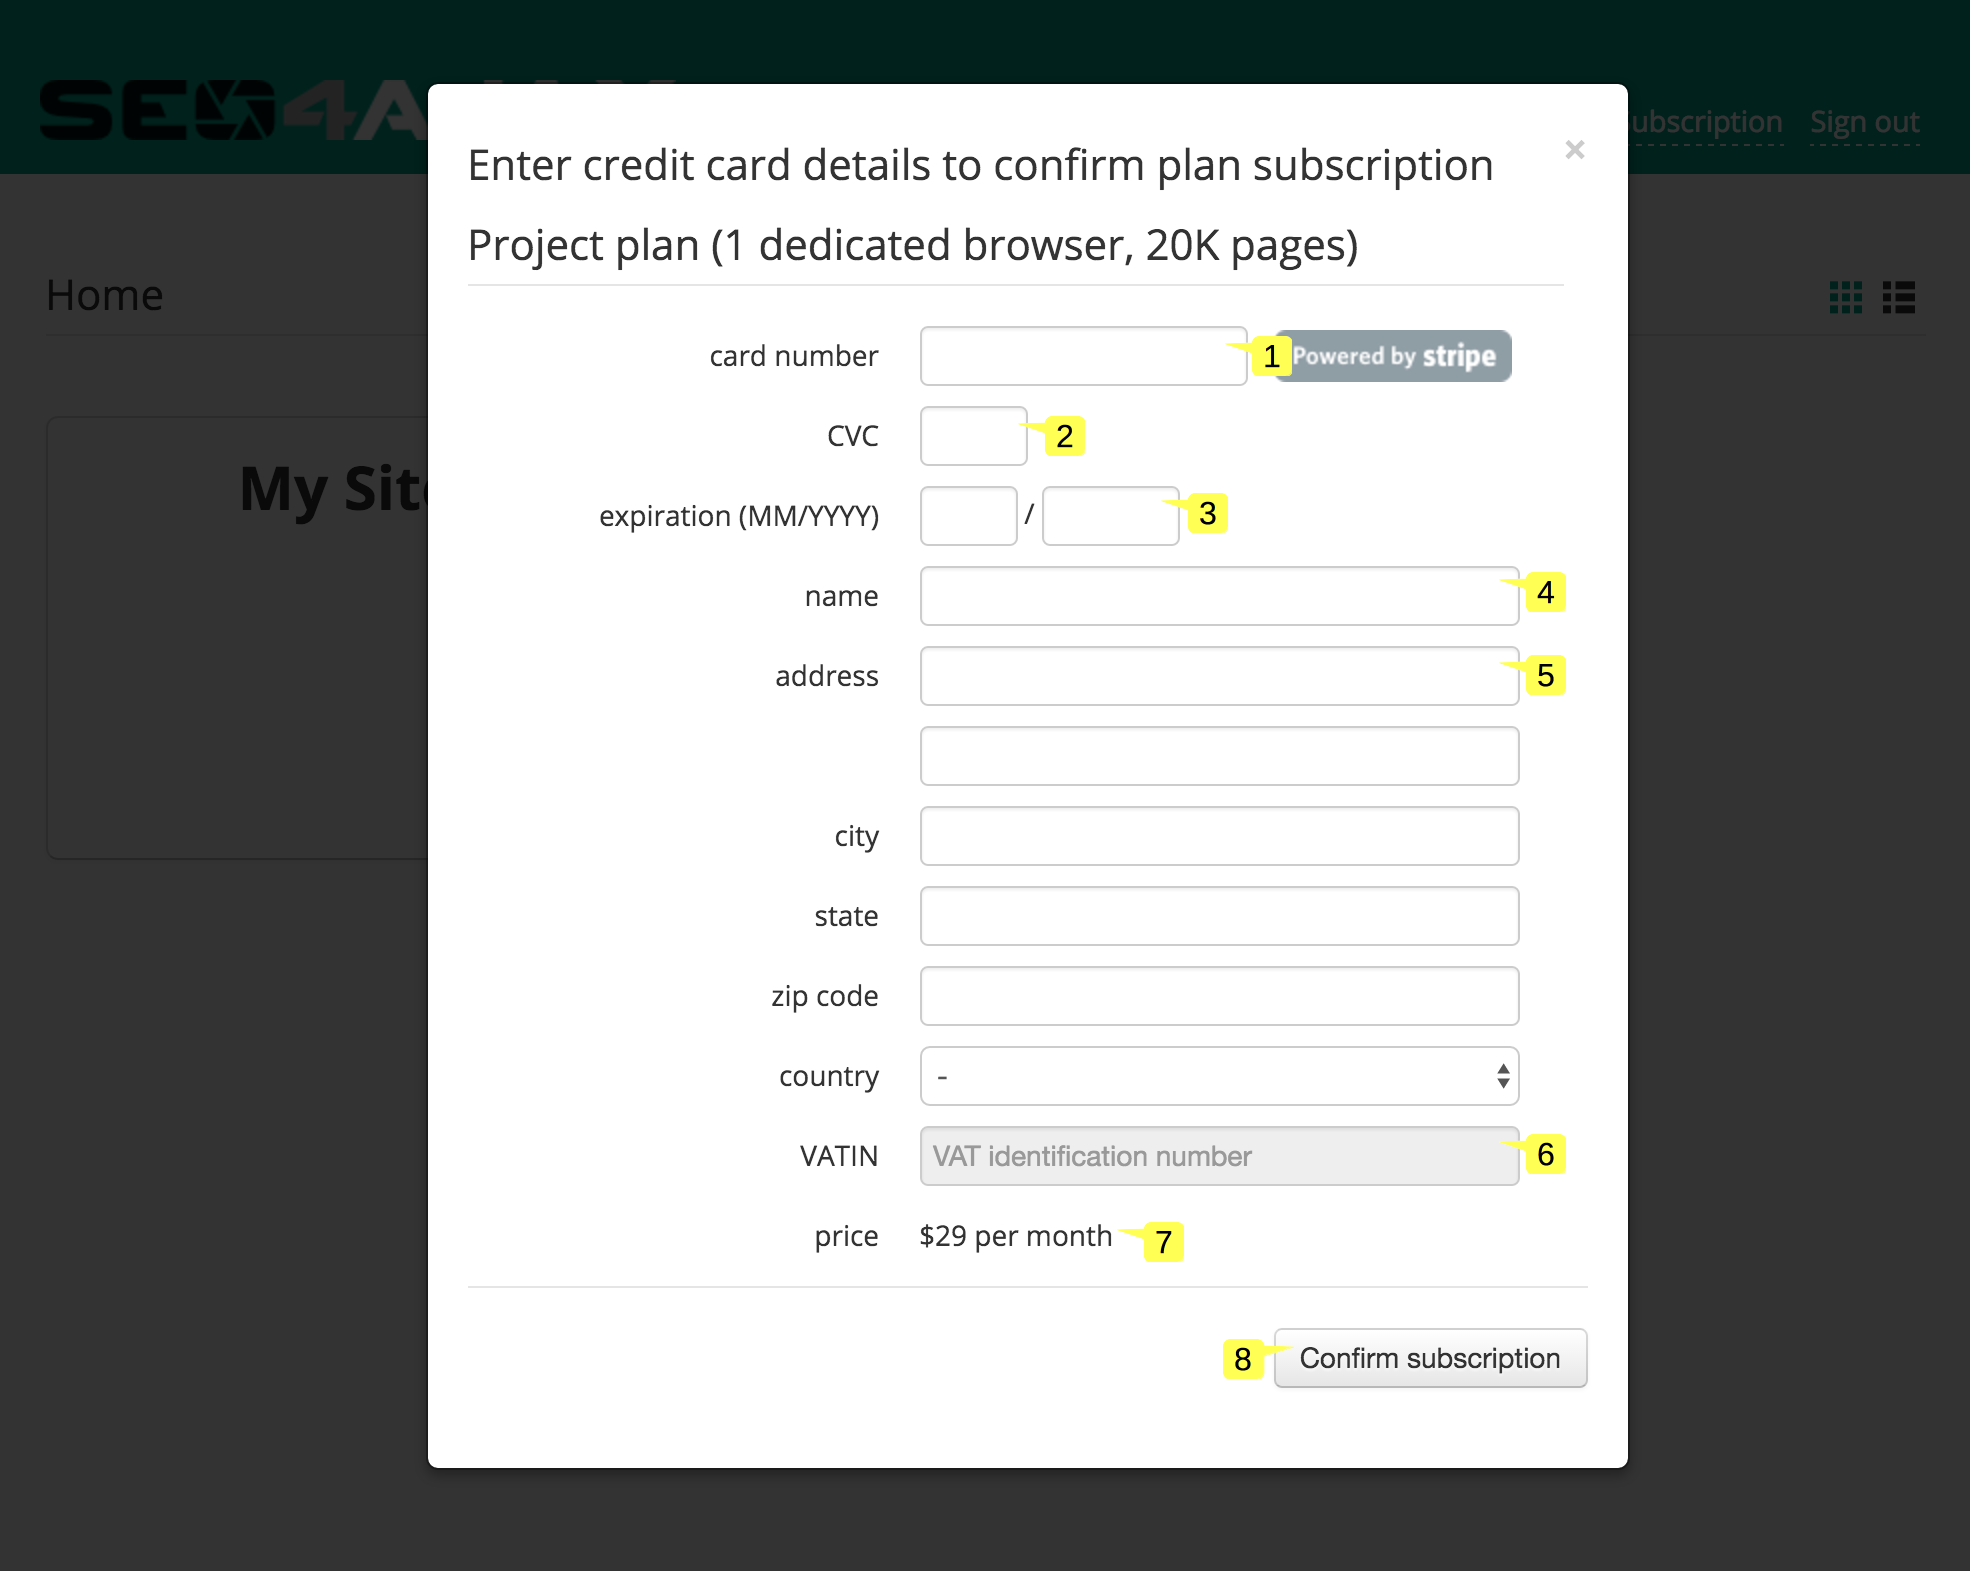
- Type your credit card number 1
- Type the credit card verification code 2
- Type the credit card expiration date 3
- Type the card owner name 4
- Type the card owner full address 5
- Type your company VAT identifier 6 if you are located in Europe
- The price of the selected plan 7 is displayed below the VAT identifier input field
- Press the "Confirm subscription" button 8 to save the credit card details and the plan subscription. Once registered, the Site settings page is displayed in order to launch the first crawl.
Account settings
This page is displayed when you click on the "Account settings" link in the header of the Home page. It allows modifying your email address and the password used to identify yourself in the console. It also allows registering the credit card details, setting the billing address, and viewing past or upcoming invoices.
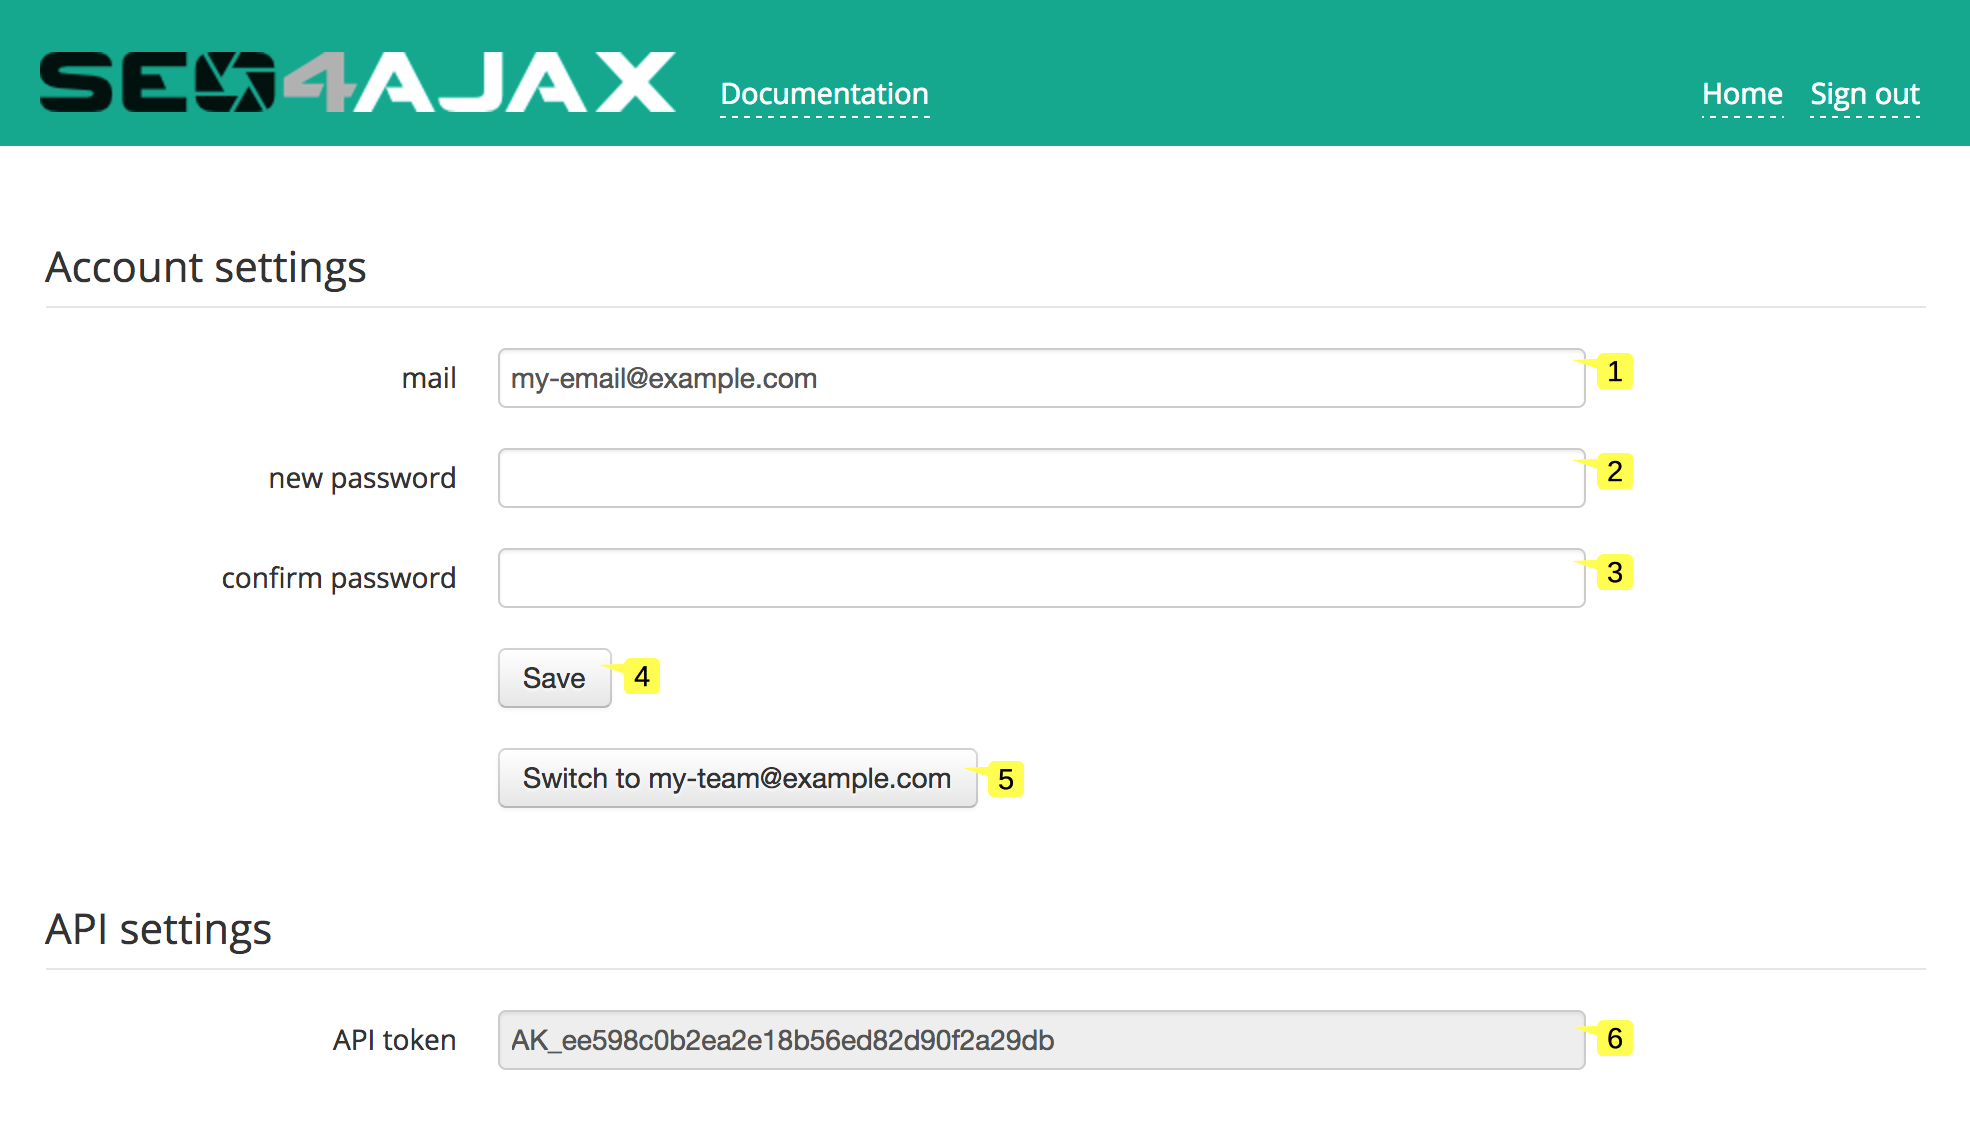
- Type your new email address 1
- Type your new password 2
- Confirm your new password 3
- Press the "Save" button 4 to save the new settings
- Press the "Switch to ..." button 5 to access the account another user shared with you (or to switch back to your account)
- The API token is read-only 6, it is used to request the SEO4Ajax authenticated API
Account settings - allowed users
Adding allowed users on your account allows you to give access to your account to other SEO4Ajax users. After being added to the list, allowed users will have to click on the "Switch to ..." button (5 in the previous screenshot) to access your account.
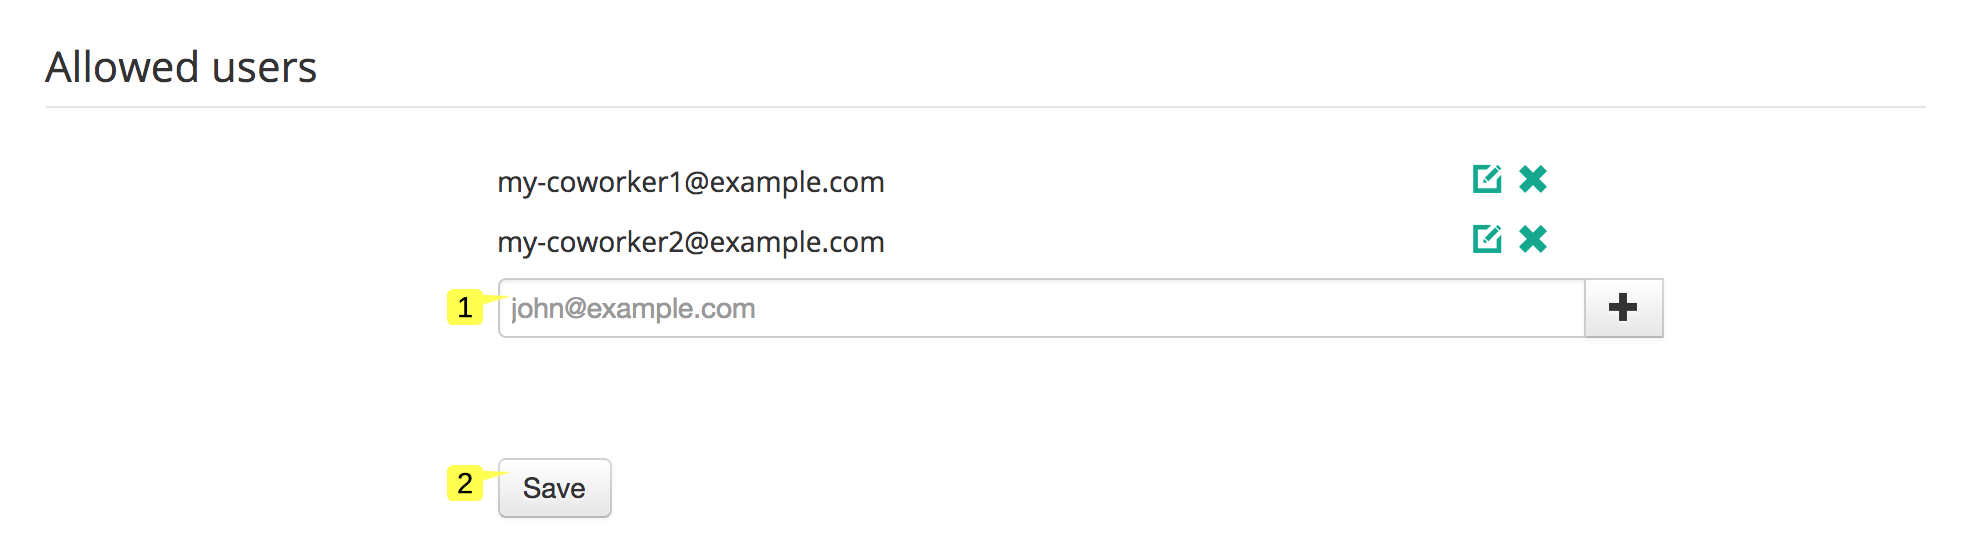
- Type the email addresses of users with whom you want to share your account 1
- Press the "Save" button 2 to save the new allowed users list
Account settings - credit card details
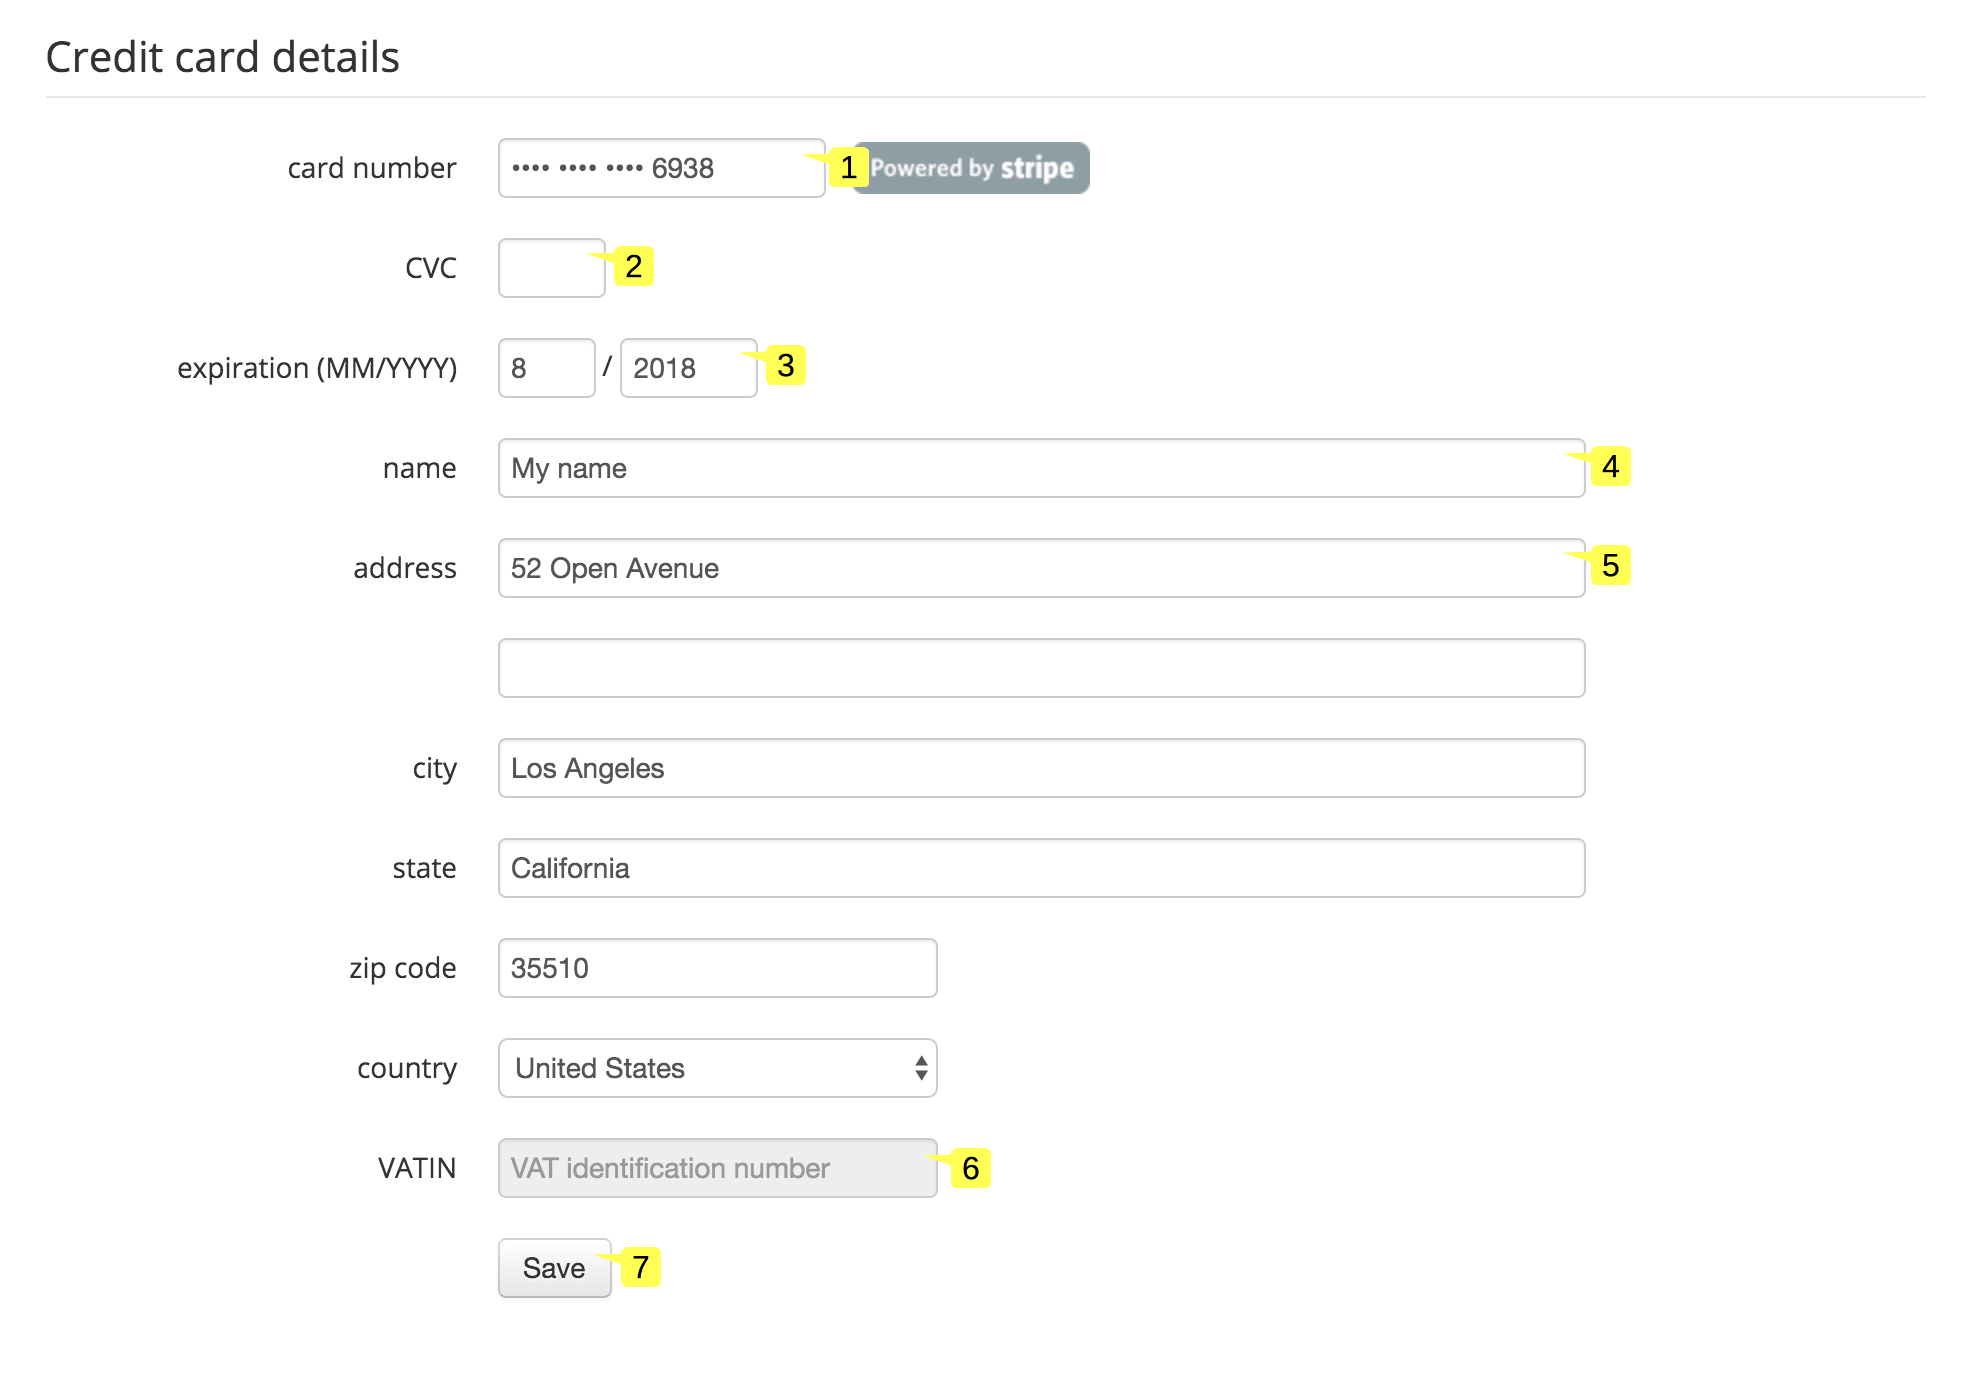
- Type your credit card number 1
- Type the credit card verification code 2
- Type the credit card expiration date 3
- Type the card owner name 4
- Type the card owner full address 5
- Type your company VAT identifier 6 if you are located in Europe
- Press the "Save" button 7 to save the new settings
Account settings - billing details
If needed, you can set a billing address for your invoices. By default the email address of the account owner and the postal address of the credit card owner will be used if the billing details are not provided.
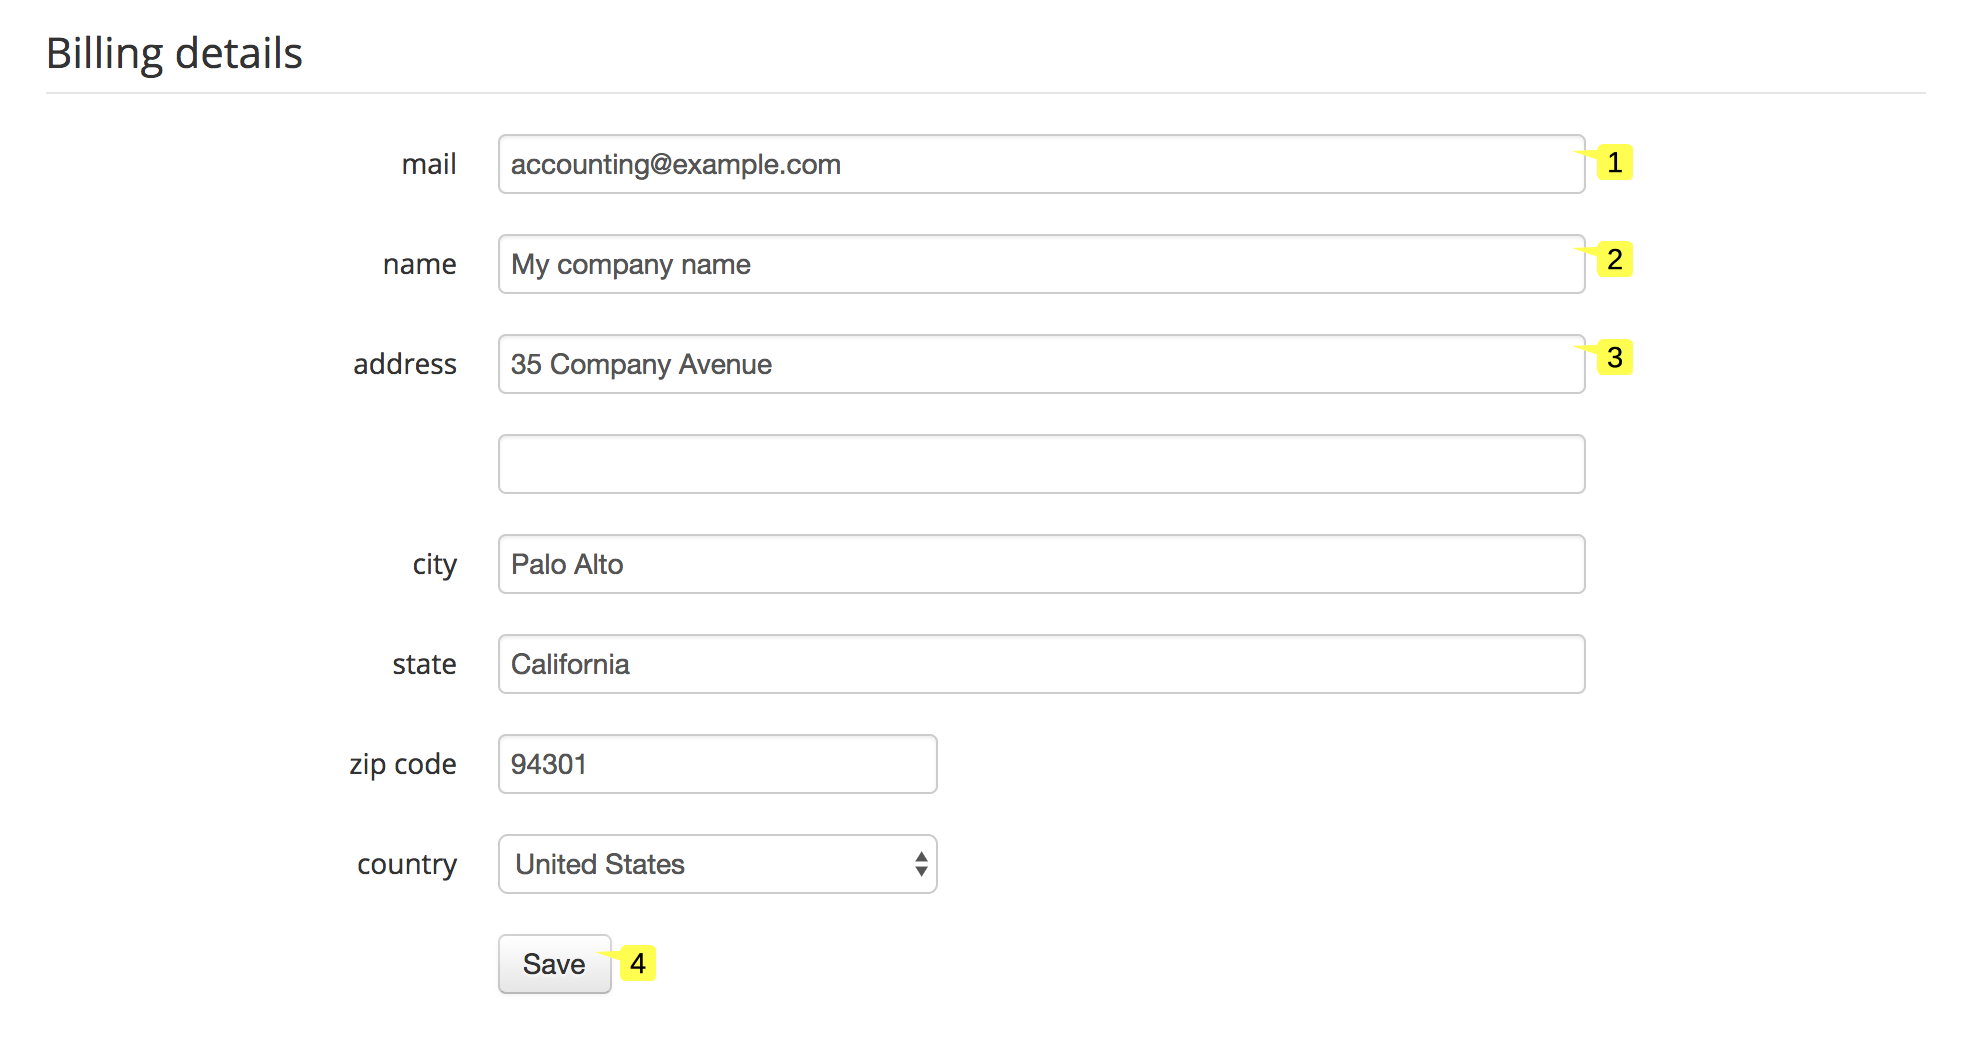
- Type the email address on which invoices will be sent 1
- Type your company name 2
- Type your company full address 3
- Press the "Save" button 4 to save the new settings
Account settings - service usage and invoices
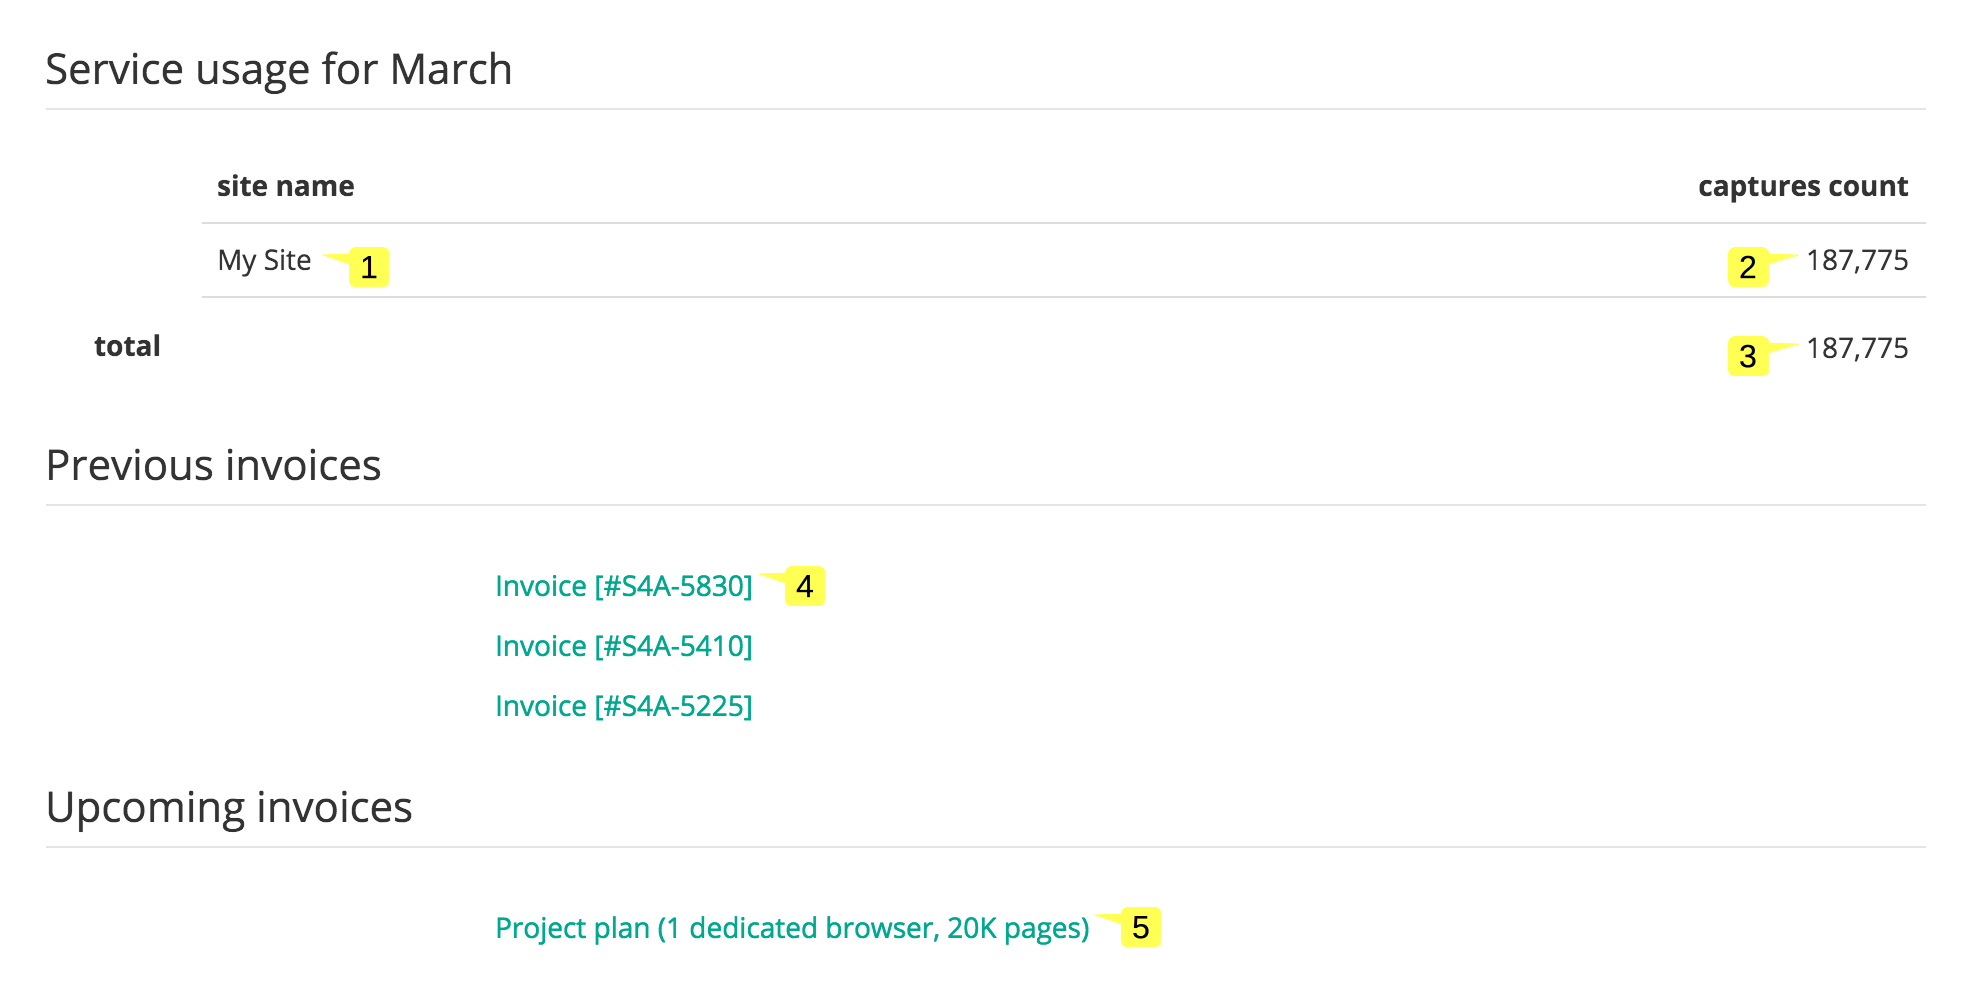
- Each row in the table displays the name of a site 1 and its total number of captured pages during the month 2
- The overall number of captured pages is displayed below the table 3
- Click on the link 4 of any of your previous invoices to retrieve it
- Click on the link 5 of your upcoming invoice to preview it
Subscription
This page is displayed when you click on the "Subscription" link in the header of the Home page. It allows managing your subscription.
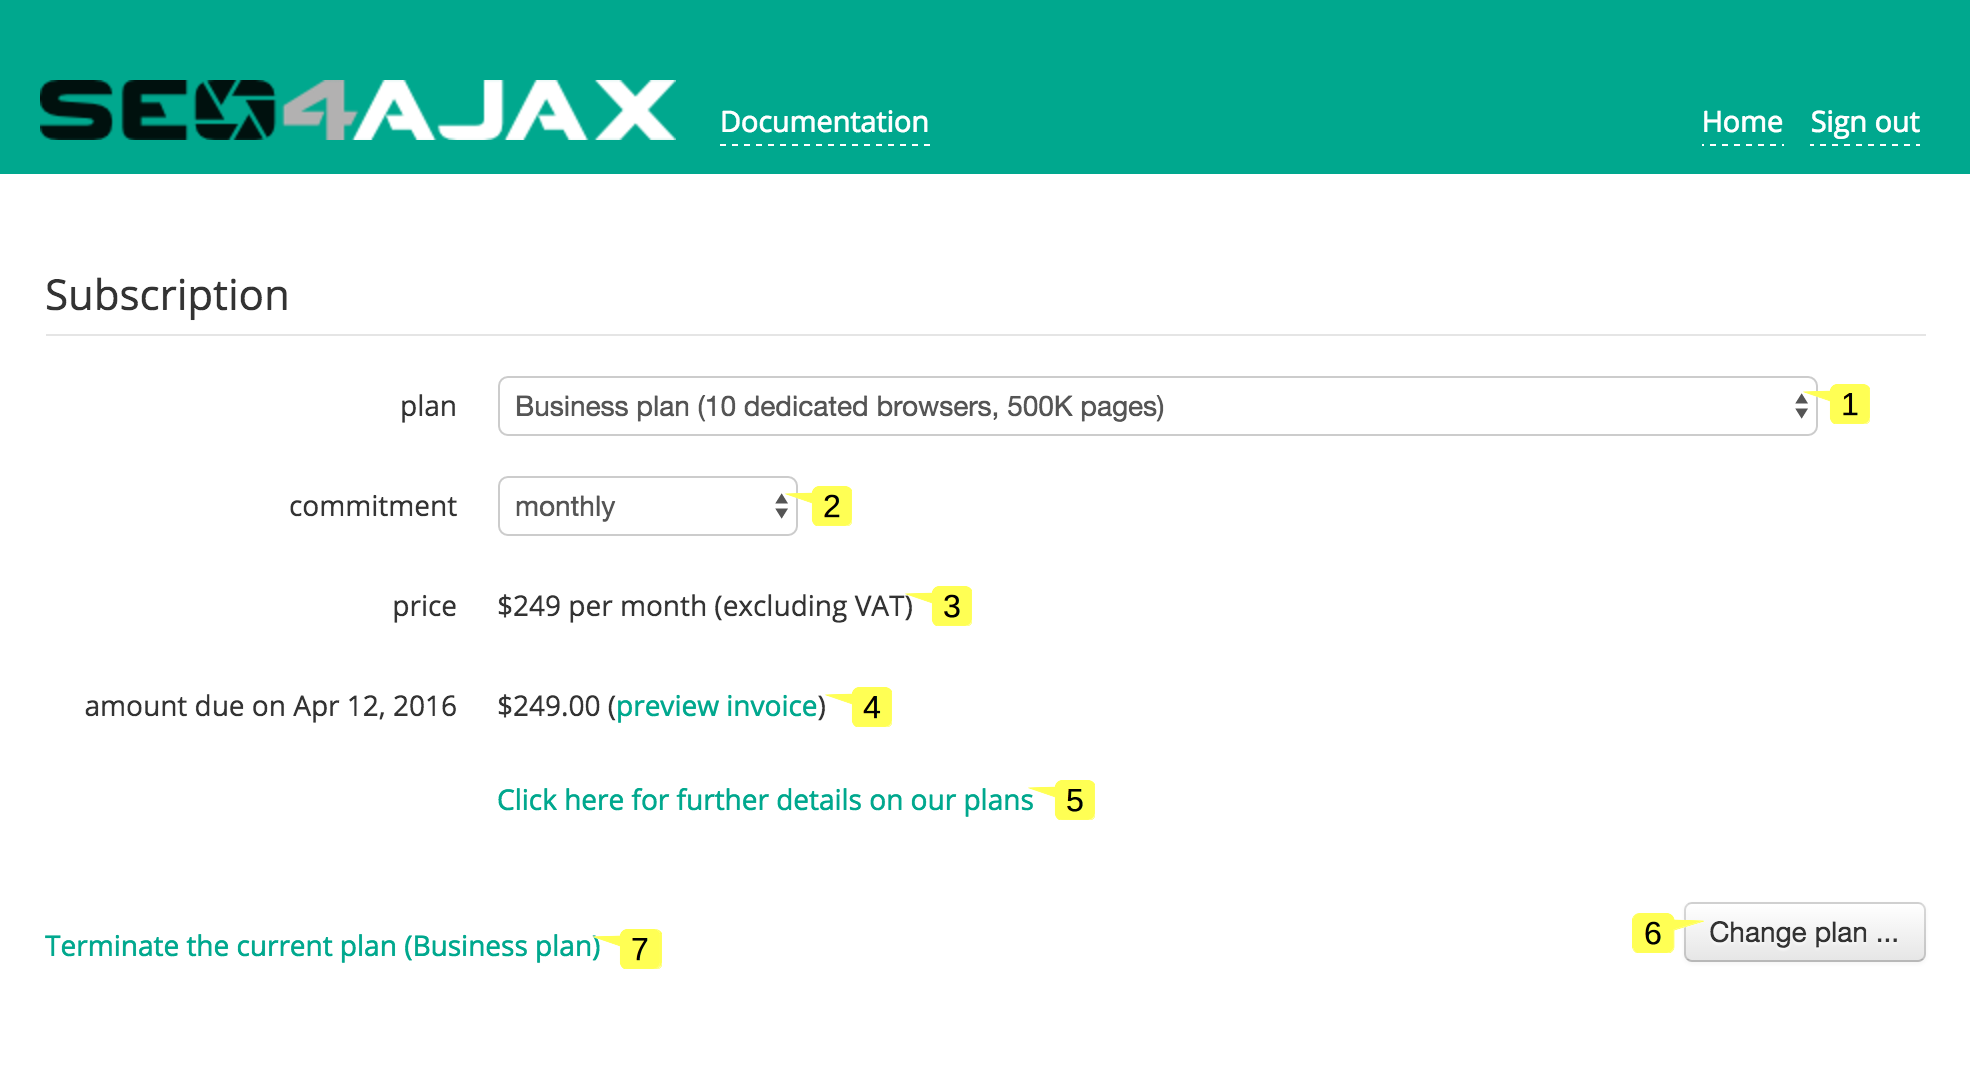
- Choose the desired plan 1
- Choose the commitment 2
- The corresponding price is displayed below the input fields 3
- The ending date of the plan and the amount due for the next invoice 4 are displayed below the price
- Click on the link 5 to get more information on available plans
- Press the "Change plan..." button 6 to confirm the action and change the current plan
- Click on 7 to terminate your paid subscription and go back to the free plan
Header links
The header links allow navigating in the different pages of the console.
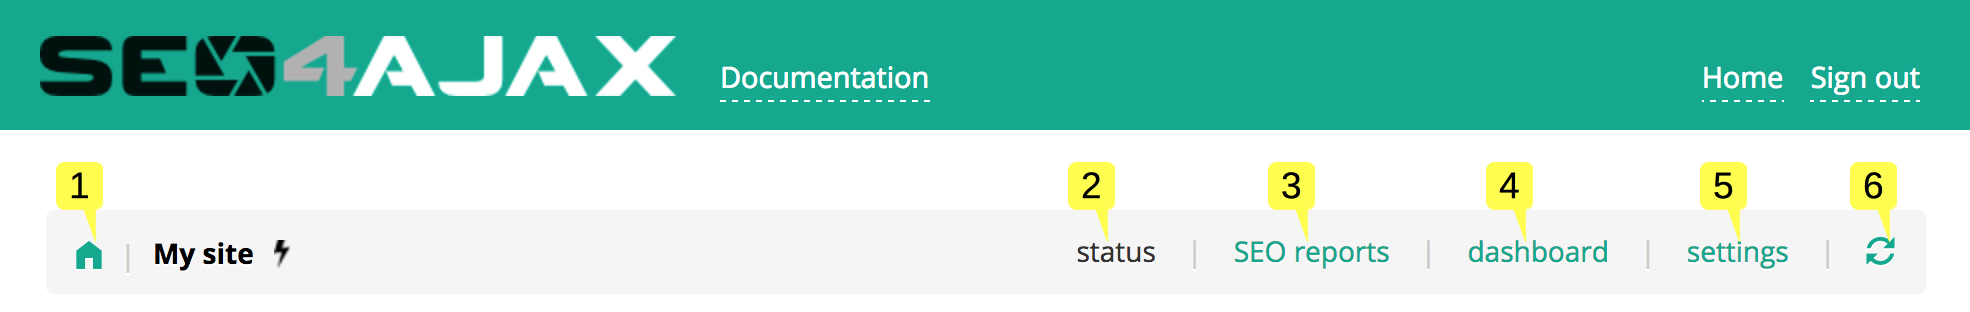
- Click on the home icon 1 to go back to the Home page
- Click on the "status" link 2 to go to the Site status page
- Click on the "SEO reports" link 3 to go to the SEO reports page
- Click on the "dashboard" link 4 to go to the Dashboard page
- Click on the "settings" link 5 to go to the Site settings page
- Click on the refresh icon 6 to refresh the view
Site status
This page is displayed when you press the button of any site in the Home page or click on the "status" link of the header. It allows:
- activating/deactivating the crawler
- viewing and filtering captures, errors and paths being captured
- adding paths to capture
- downloading the generated sitemap
- deleting captures
- debugging capture issues
Common elements
These elements are common to "captures", "errors", "pendings" and "logs" views.
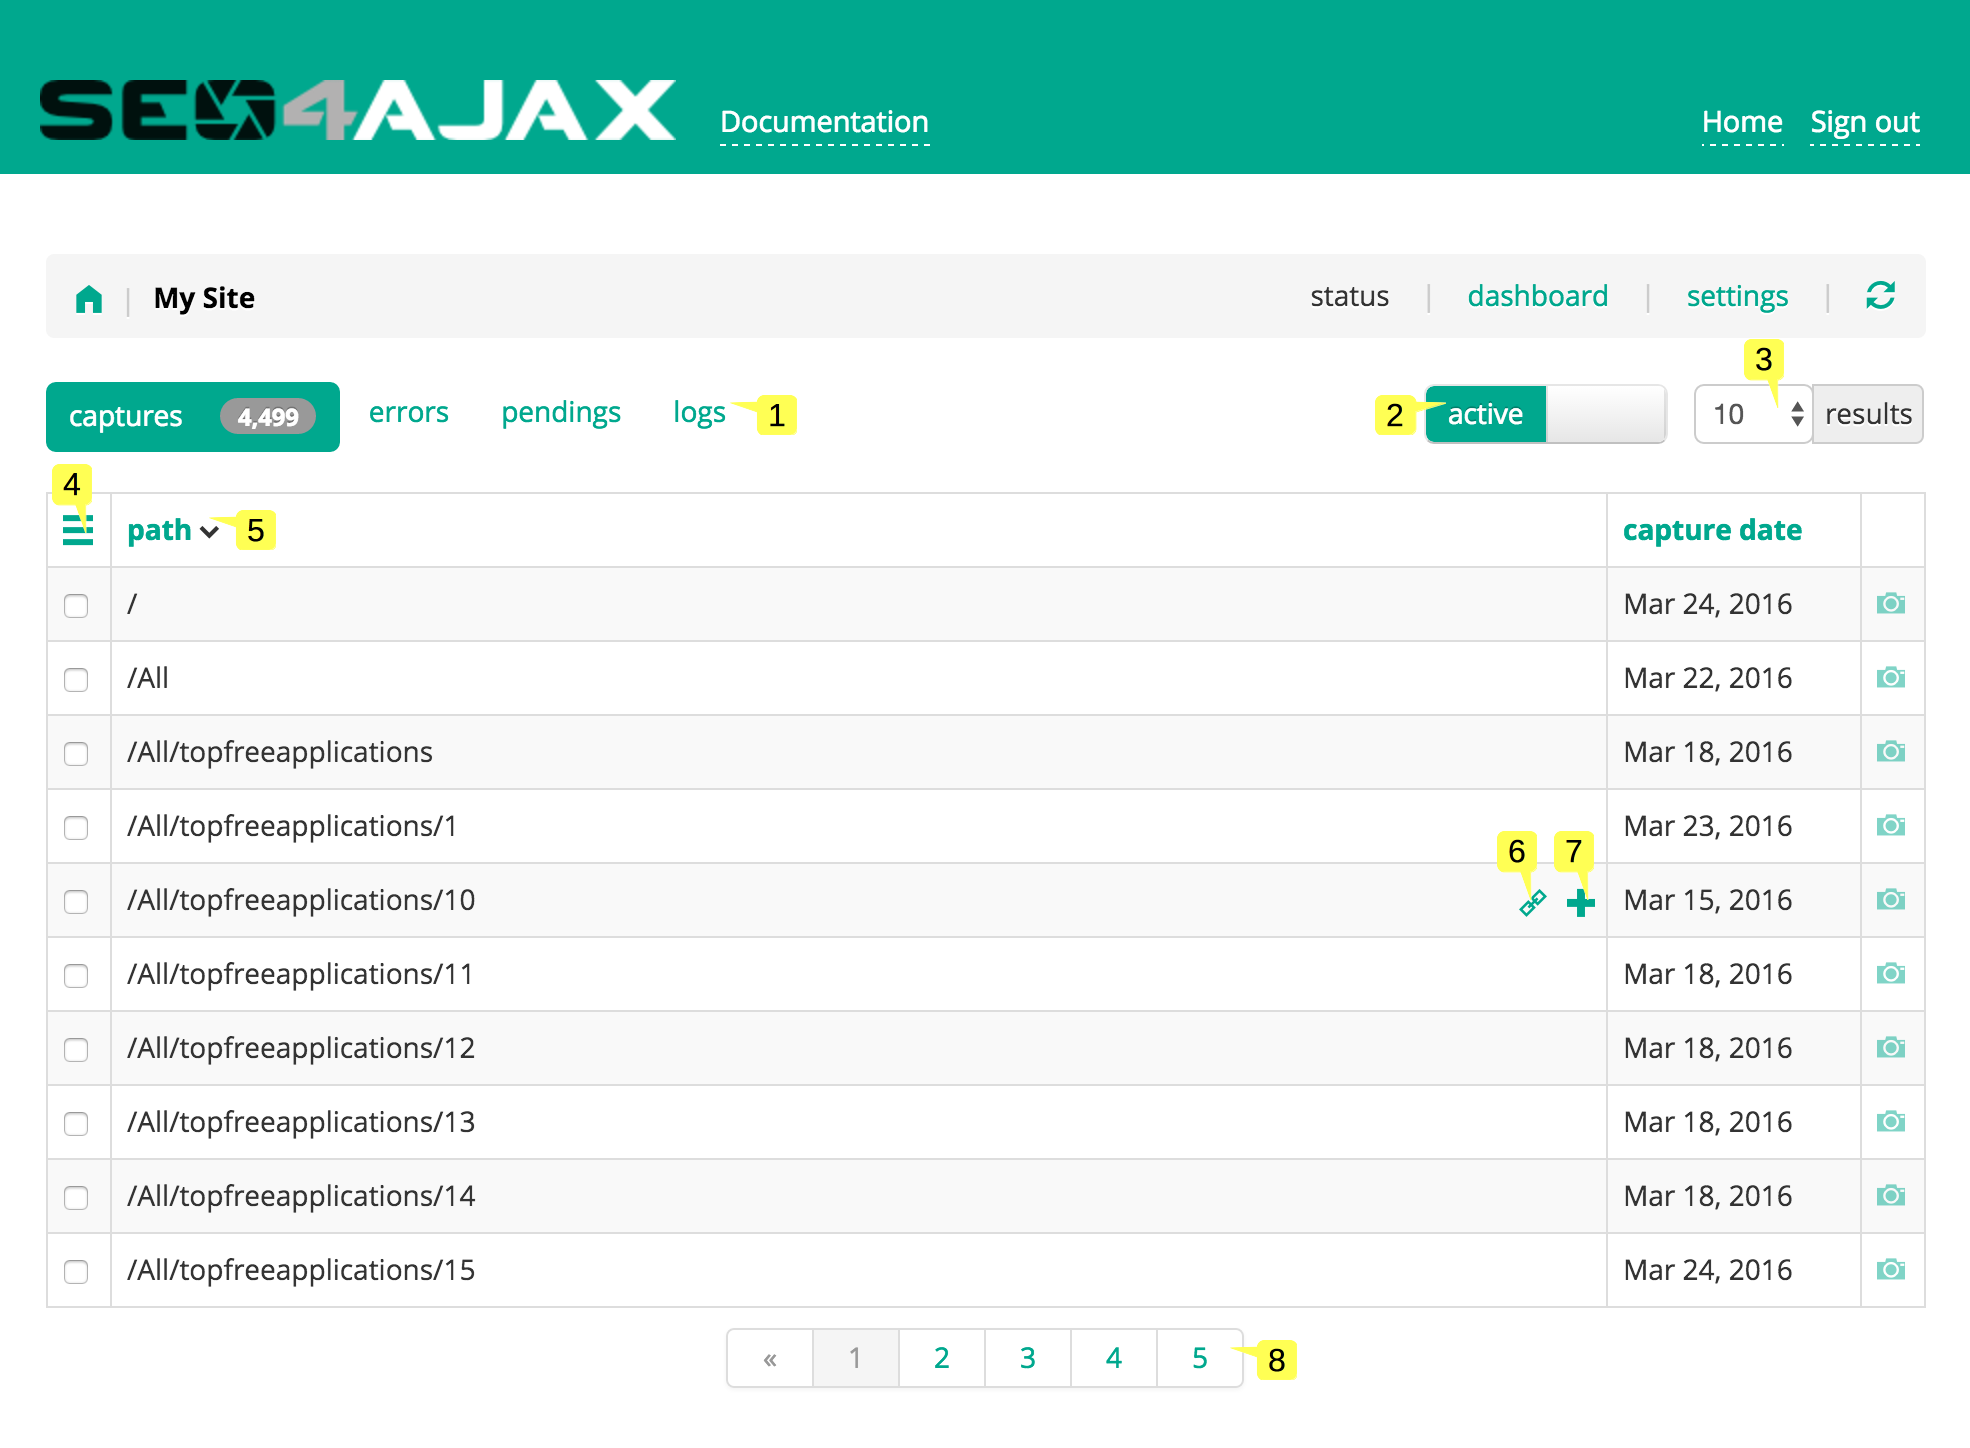
- Click on the "captures", "errors", "pendings" or "logs" tab 1 to display the corresponding view
- Press the "active/paused" switch button 2 to activate or deactivate the crawler
- Select the number of results 3 displayed in the current view
- Click on the menu icon 4 to open the contextual menu of the current view
- Click on a column header 5 to sort results
- Click on the link icon 6 to open the URL in a new tab
- Click on the "+" icon 7 to view detailed information about a capture
- Navigate through the the results by clicking on any pagination link 8
Site status - captures
This view is displayed when you click on the "captures" tab. It displays all the paths captured by the crawler with their capture date, and allows previewing captures.
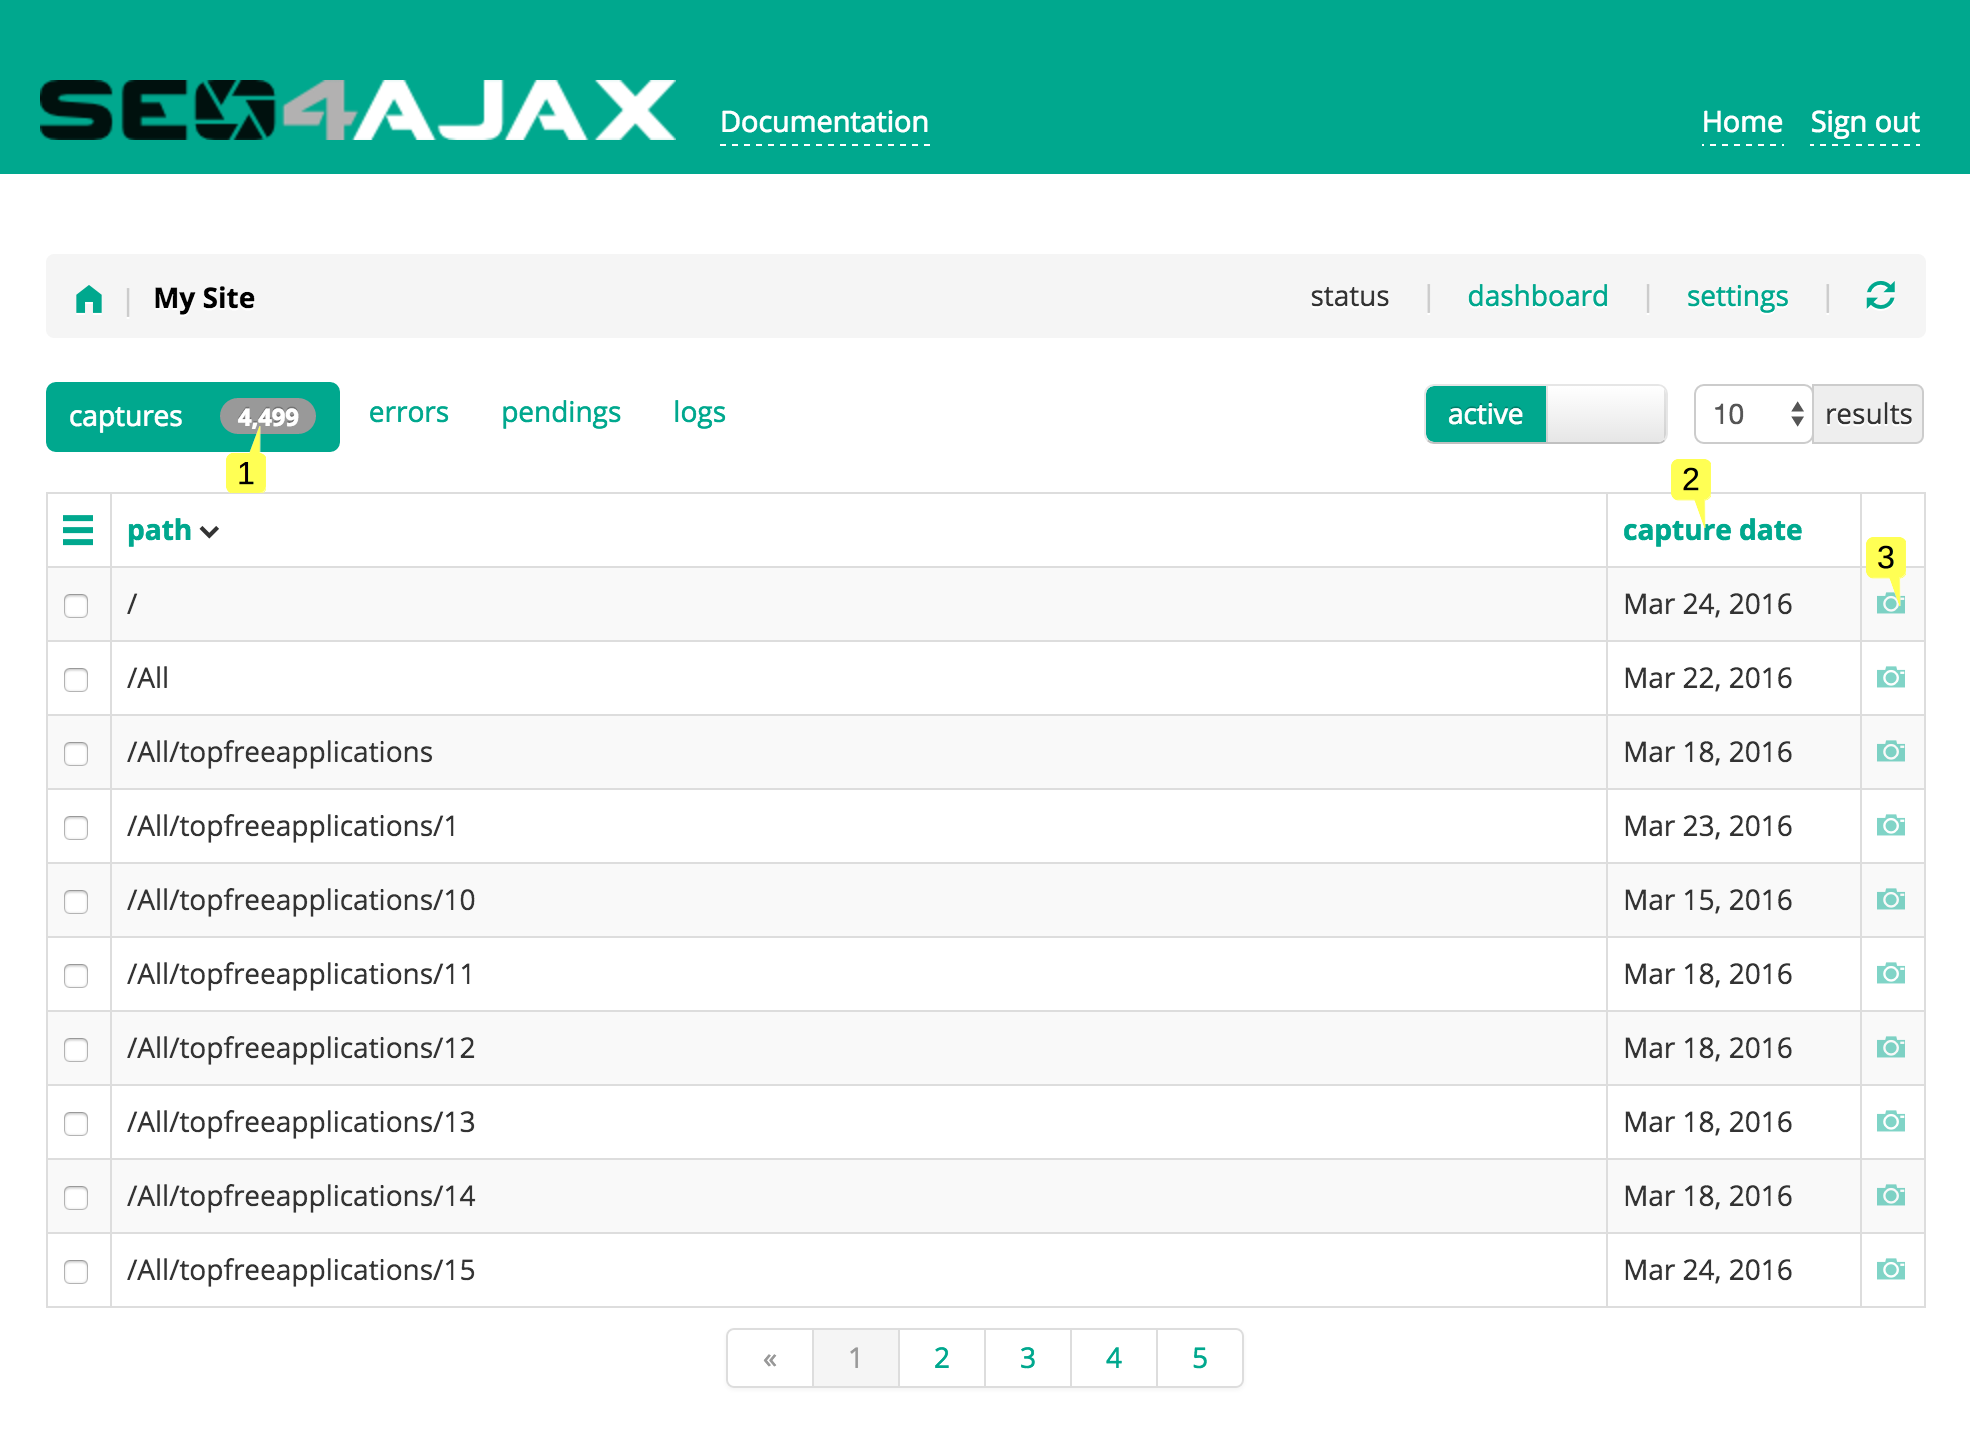
- The total number of captures is displayed next to the tab label 1
- The capture date of the page 2 is displayed for each path
- Click on the "camera" icon 3 to open the preview of a capture in a new tab
Site status - errors
This view is displayed when you click on the "errors" tab. It displays all the errors detected by the crawler with their request date and the corresponding error type.
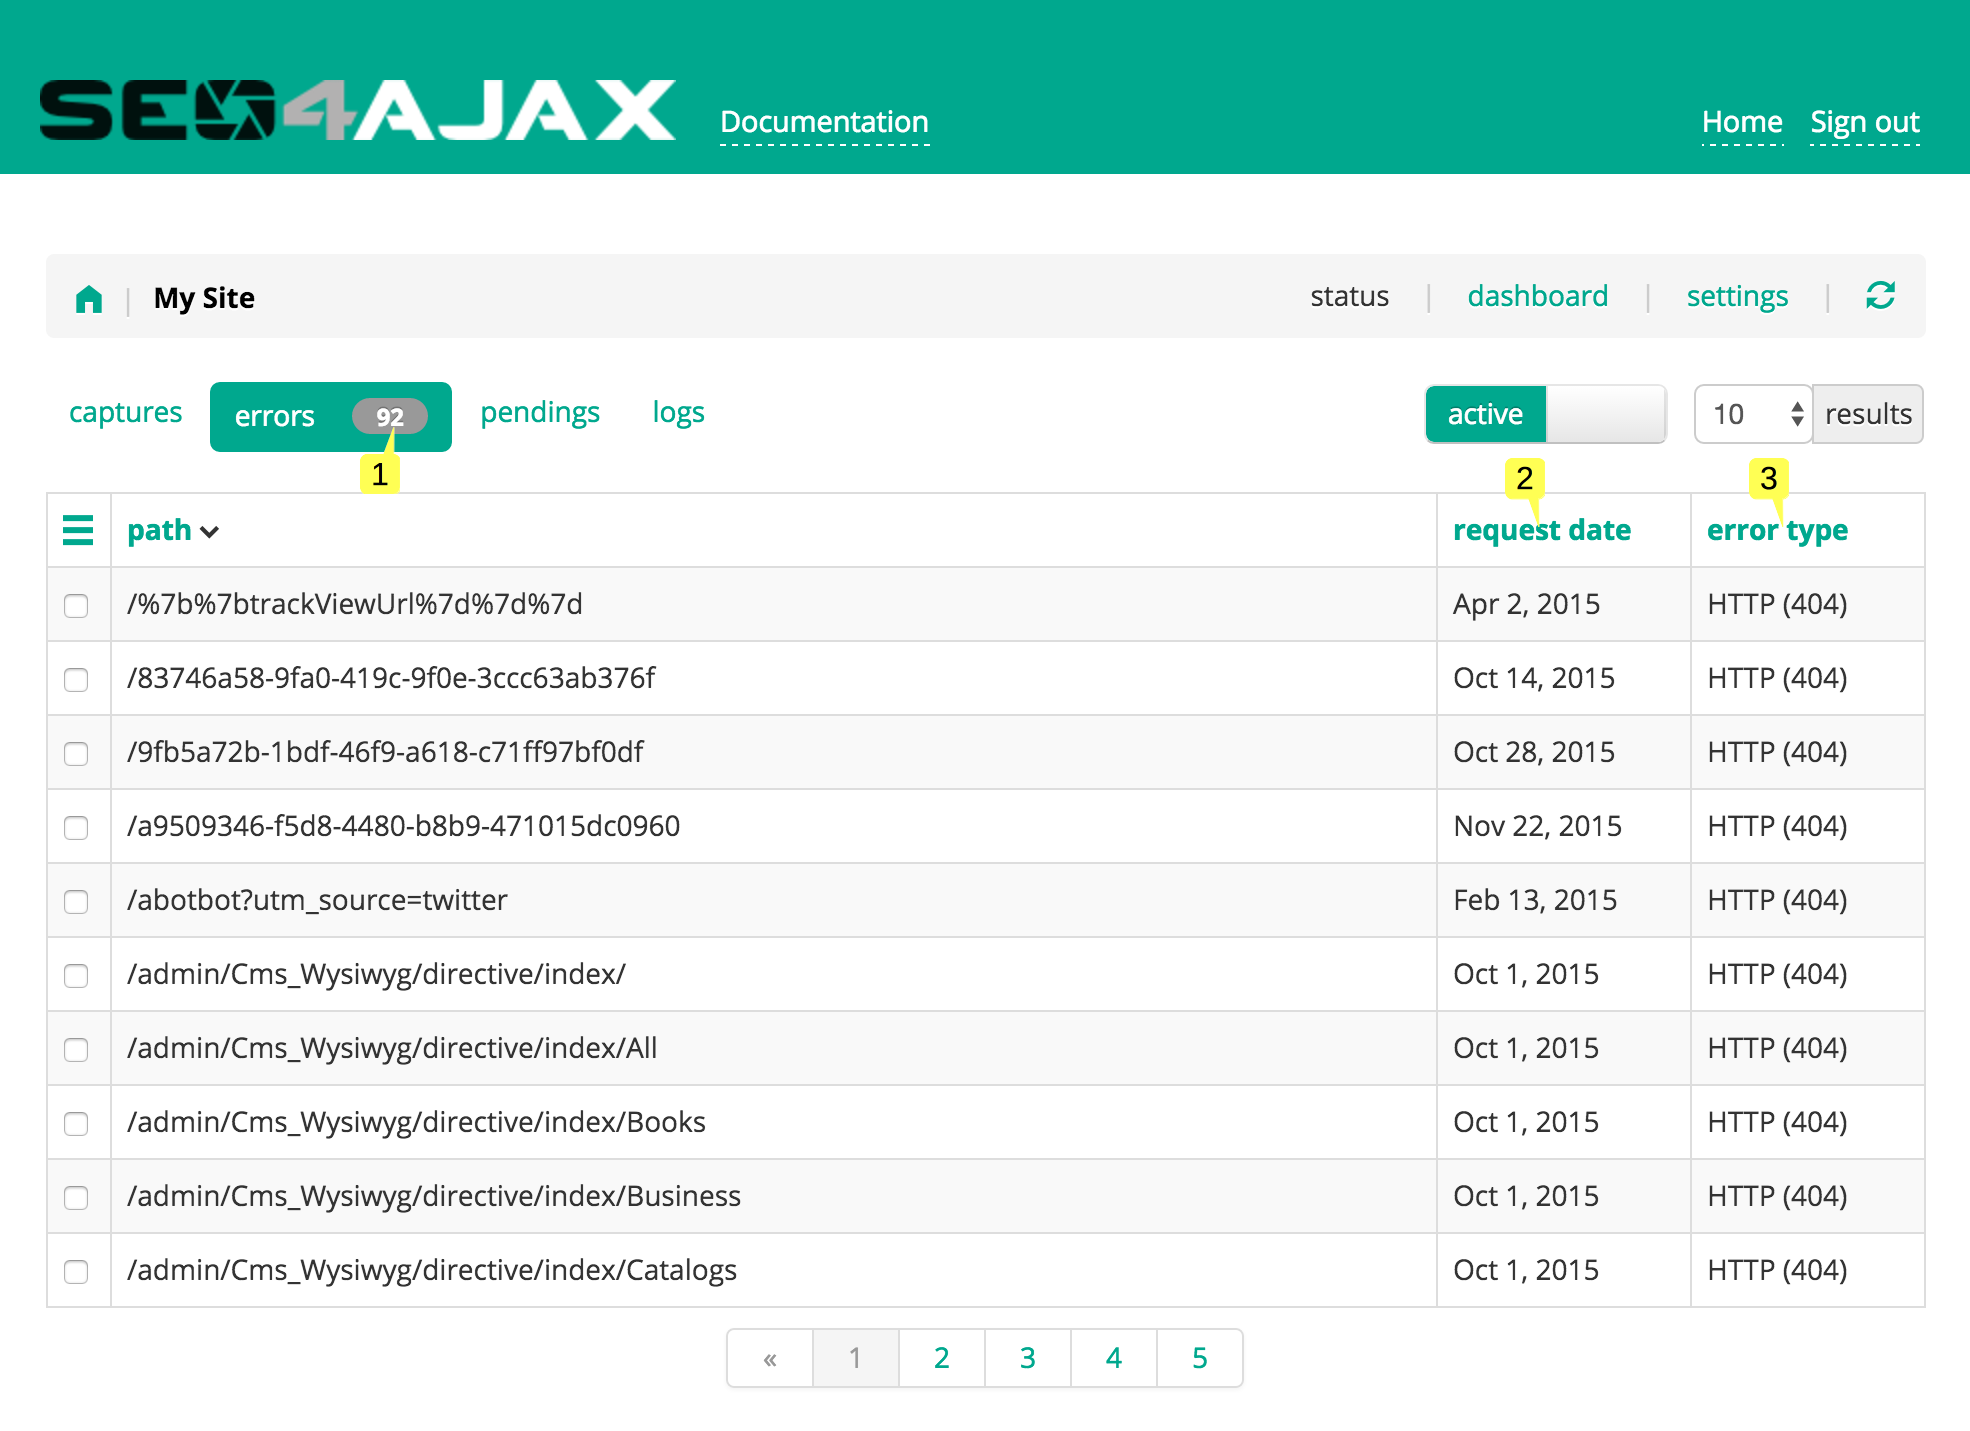
- The total number of errors is displayed next to the tab label 1
- The request date of the error 2 is displayed for each path
- The type of the error 3 is displayed for each path
Here are the possible values for the "error type" column:
HTTP (<code>)an HTTP error occurredblank pagethe body of the page is emptyunresponsivethe page rendering (i.e. the UI thread) was unresponsivenet. errora network error occured when retrieving the pageinvalid mime typethe MIME type of the capture is not one of these: "application/xhtml+xml", "application/xml", "text/html"timeout expiredthe maximum delay allowed to capture the page (150s) has been reachedquota errorthe maximum number of captures allowed by the plan has been reachedtech. errora technical error occuredmax. retryan unknown error occured
Site status - pendings
This view is displayed when you click on the "pendings" tab. It displays all the pages currently being processed by the crawler with their status.
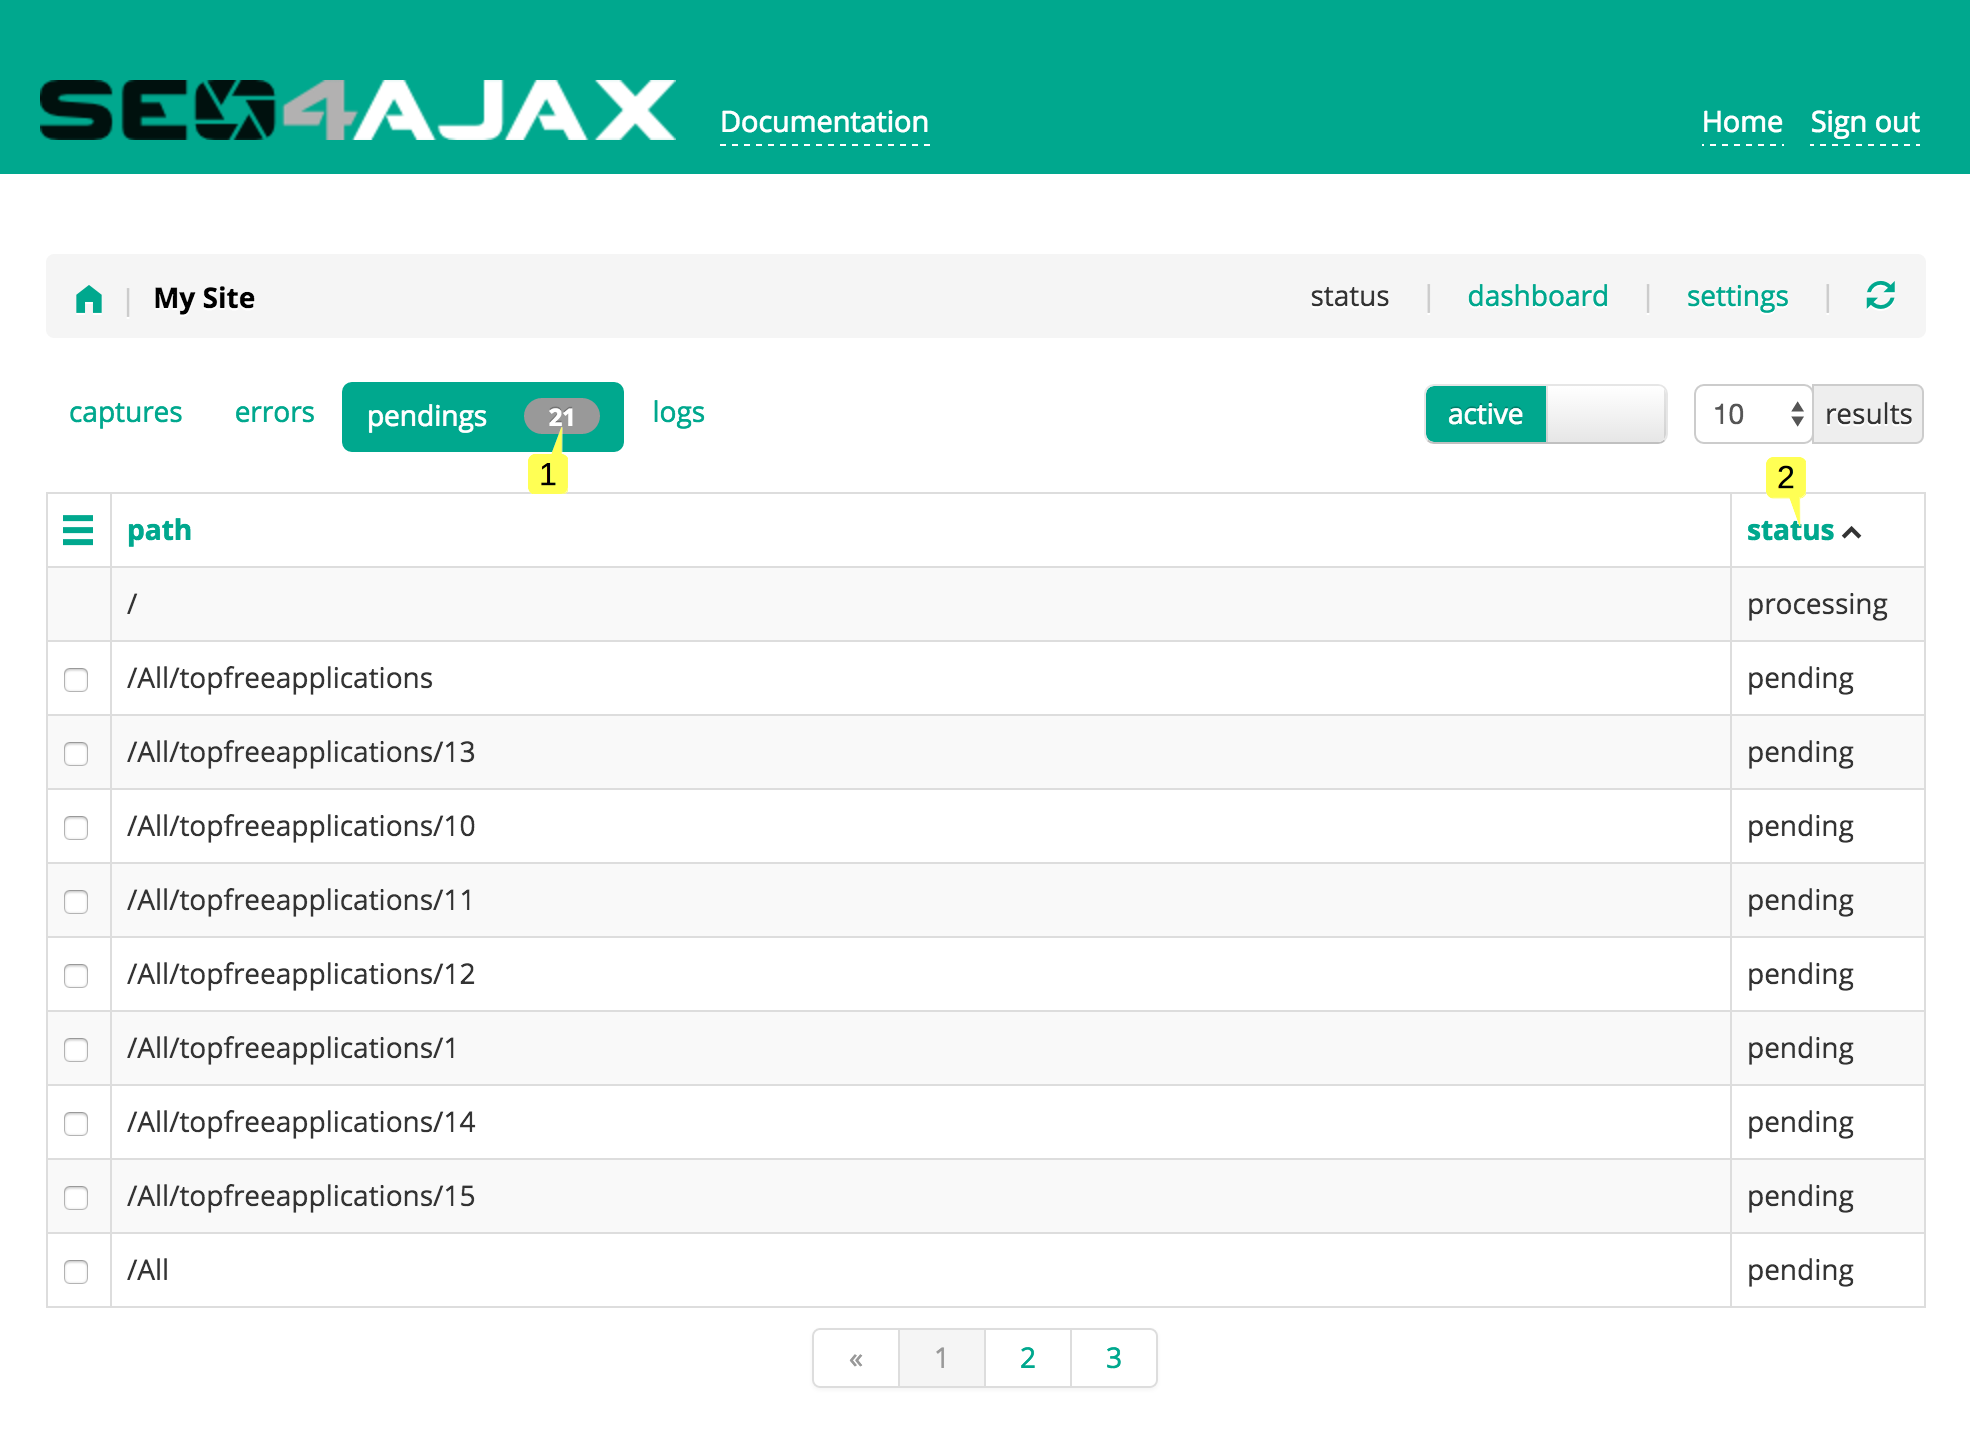
- The total number of paths being processed is displayed next to the tab label 1
- The status 2 is displayed for each path
Here are the possible values for the "status" column:
pendingthe path is queued and ready to be capturedprocessingthe path is currently being capturedpausingthe path is currently being captured and the crawler is going to be inactivepausedthe capture is paused
Site status - logs
This view is displayed when you click on the "logs" tab. It displays the saved logs of pages captured by the crawler. You must capture path(s) manually through the Capture paths popup and check the "activate debug logs" option to activate and save the logs.
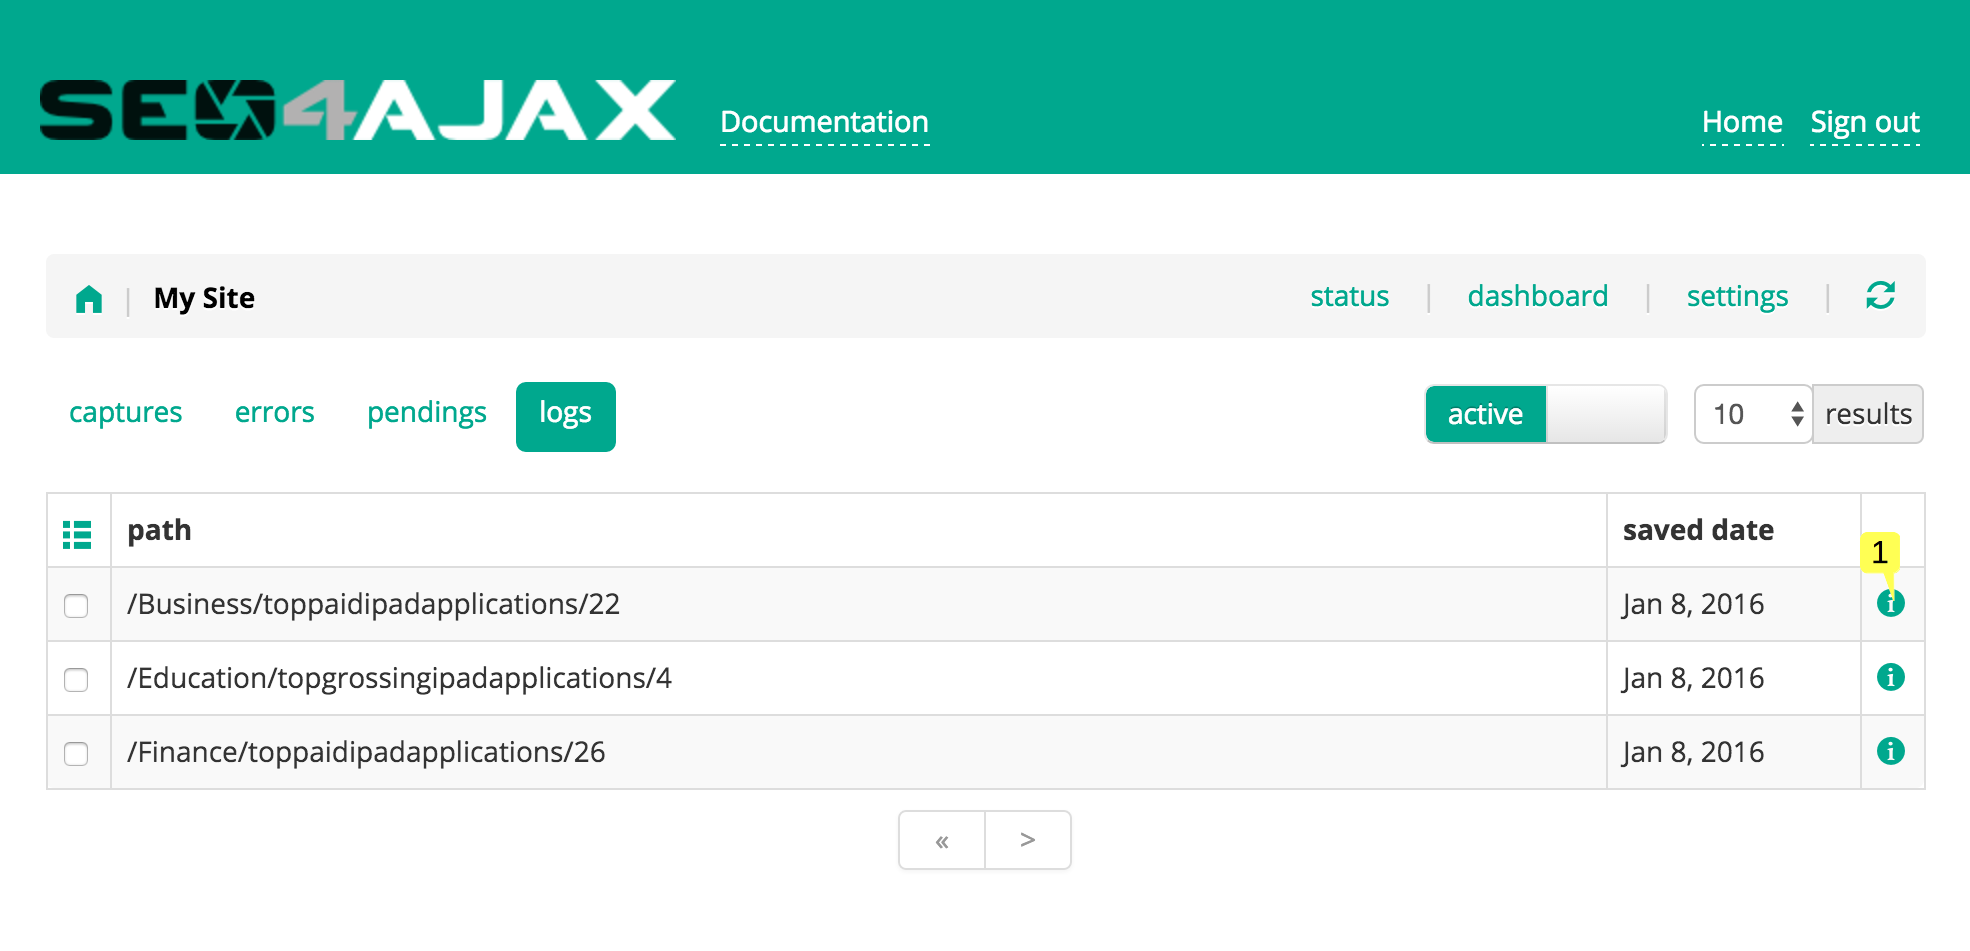
- Click on the "i" icon 1 to view the logs of a capture
Site status - cache freshness
This view is displayed when you click on the "stats" tab. It allows viewing statistics about the freshness of the cache for captures, redirects, errors and pending captures.
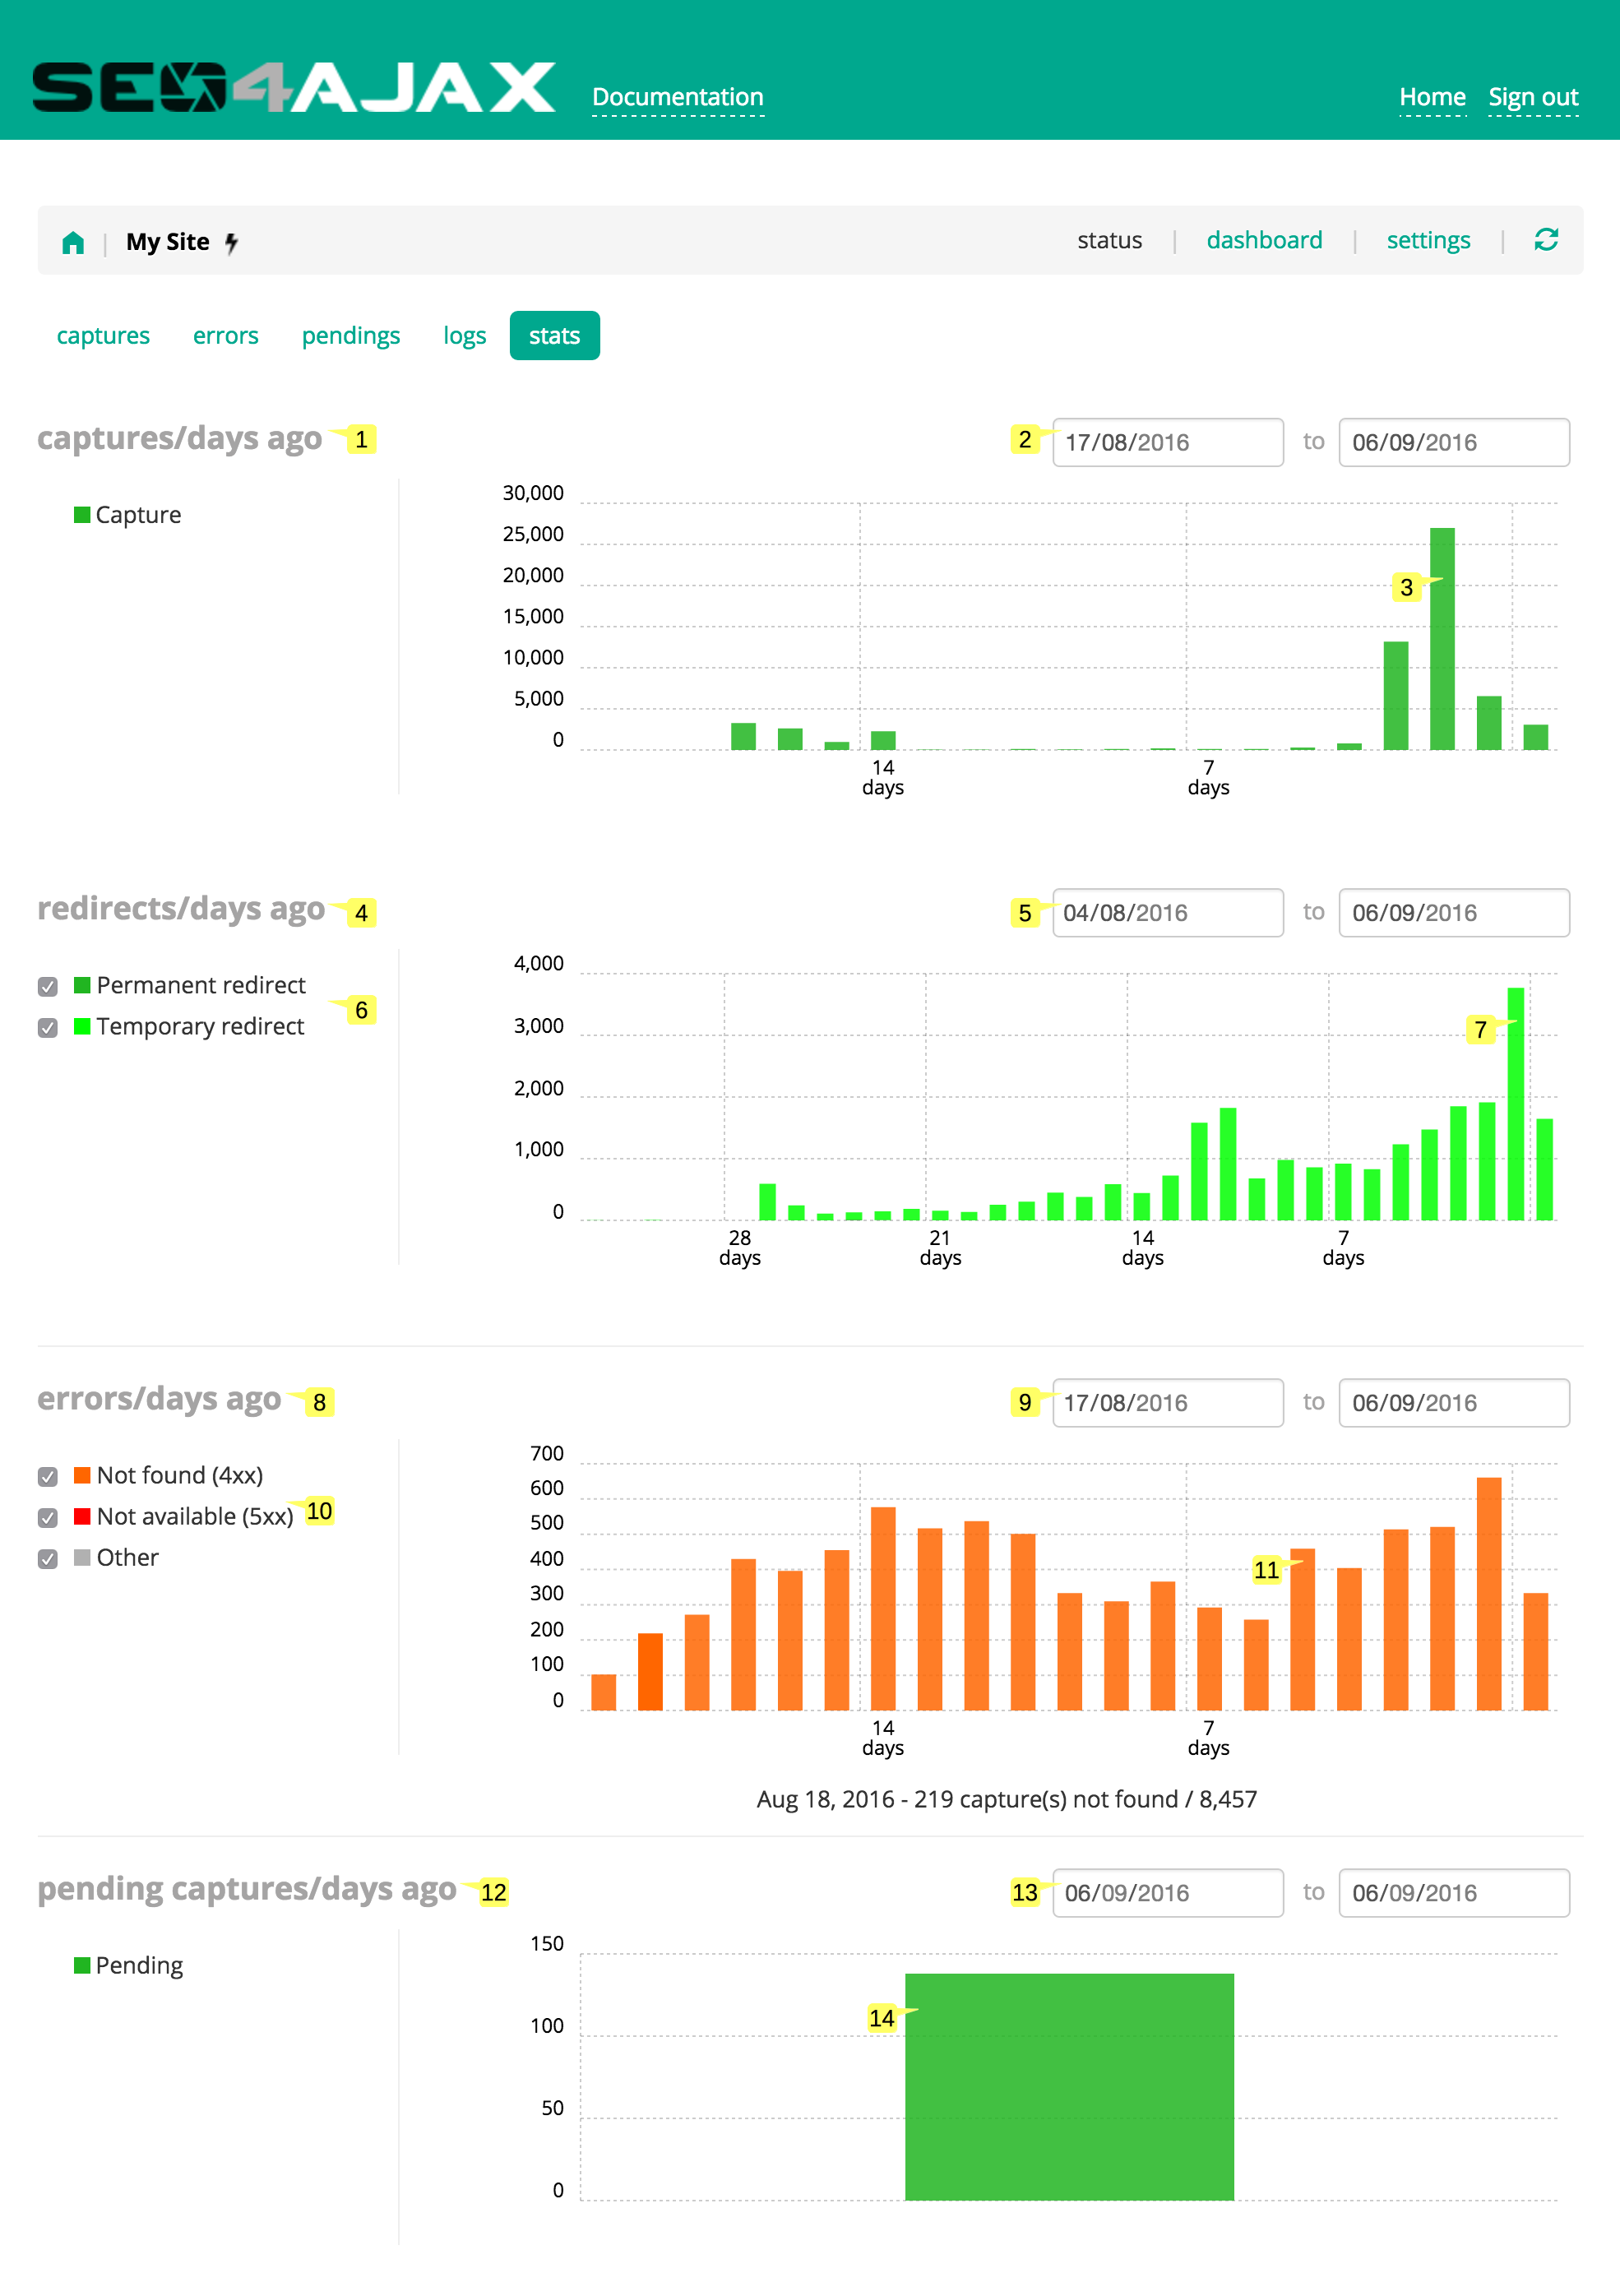
- A bar chart shows the distribution of cached pages by number of past days 1
- Type a date period 2 to only display data for this period
- Click on any bar to open the captures view and list the corresponding captures 3
- A bar chart shows the distribution of cached redirects by number of past days 4
- Type a date period 5 to only display data for this period
- Check the options to filter the type of redirects displayed in the chart 6
- Click on any bar to open the captures view and list the corresponding redirects 7
- A bar chart shows the distribution of cached errors by number of past days 8
- Type a date period 9 to only display data for this period
- Check the options to filter the type of errors displayed in the chart 10
- Click on any bar to open the errors view and list the corresponding errors 11
- A bar chart shows the distribution of pending captures freshness by number of past days 12
- Type a date period 13 to only display data for this period
- Click on any bar to open the pendings view and list the corresponding pending captures 14
Site status - contextual menu
This menu is displayed when you press the "menu" icon. It allows:
- displaying search filters
- selecting all URLs from the displayed status view
- capturing selected, filtered or new paths
- deleting existing captures
- downloading the generated sitemap(s)
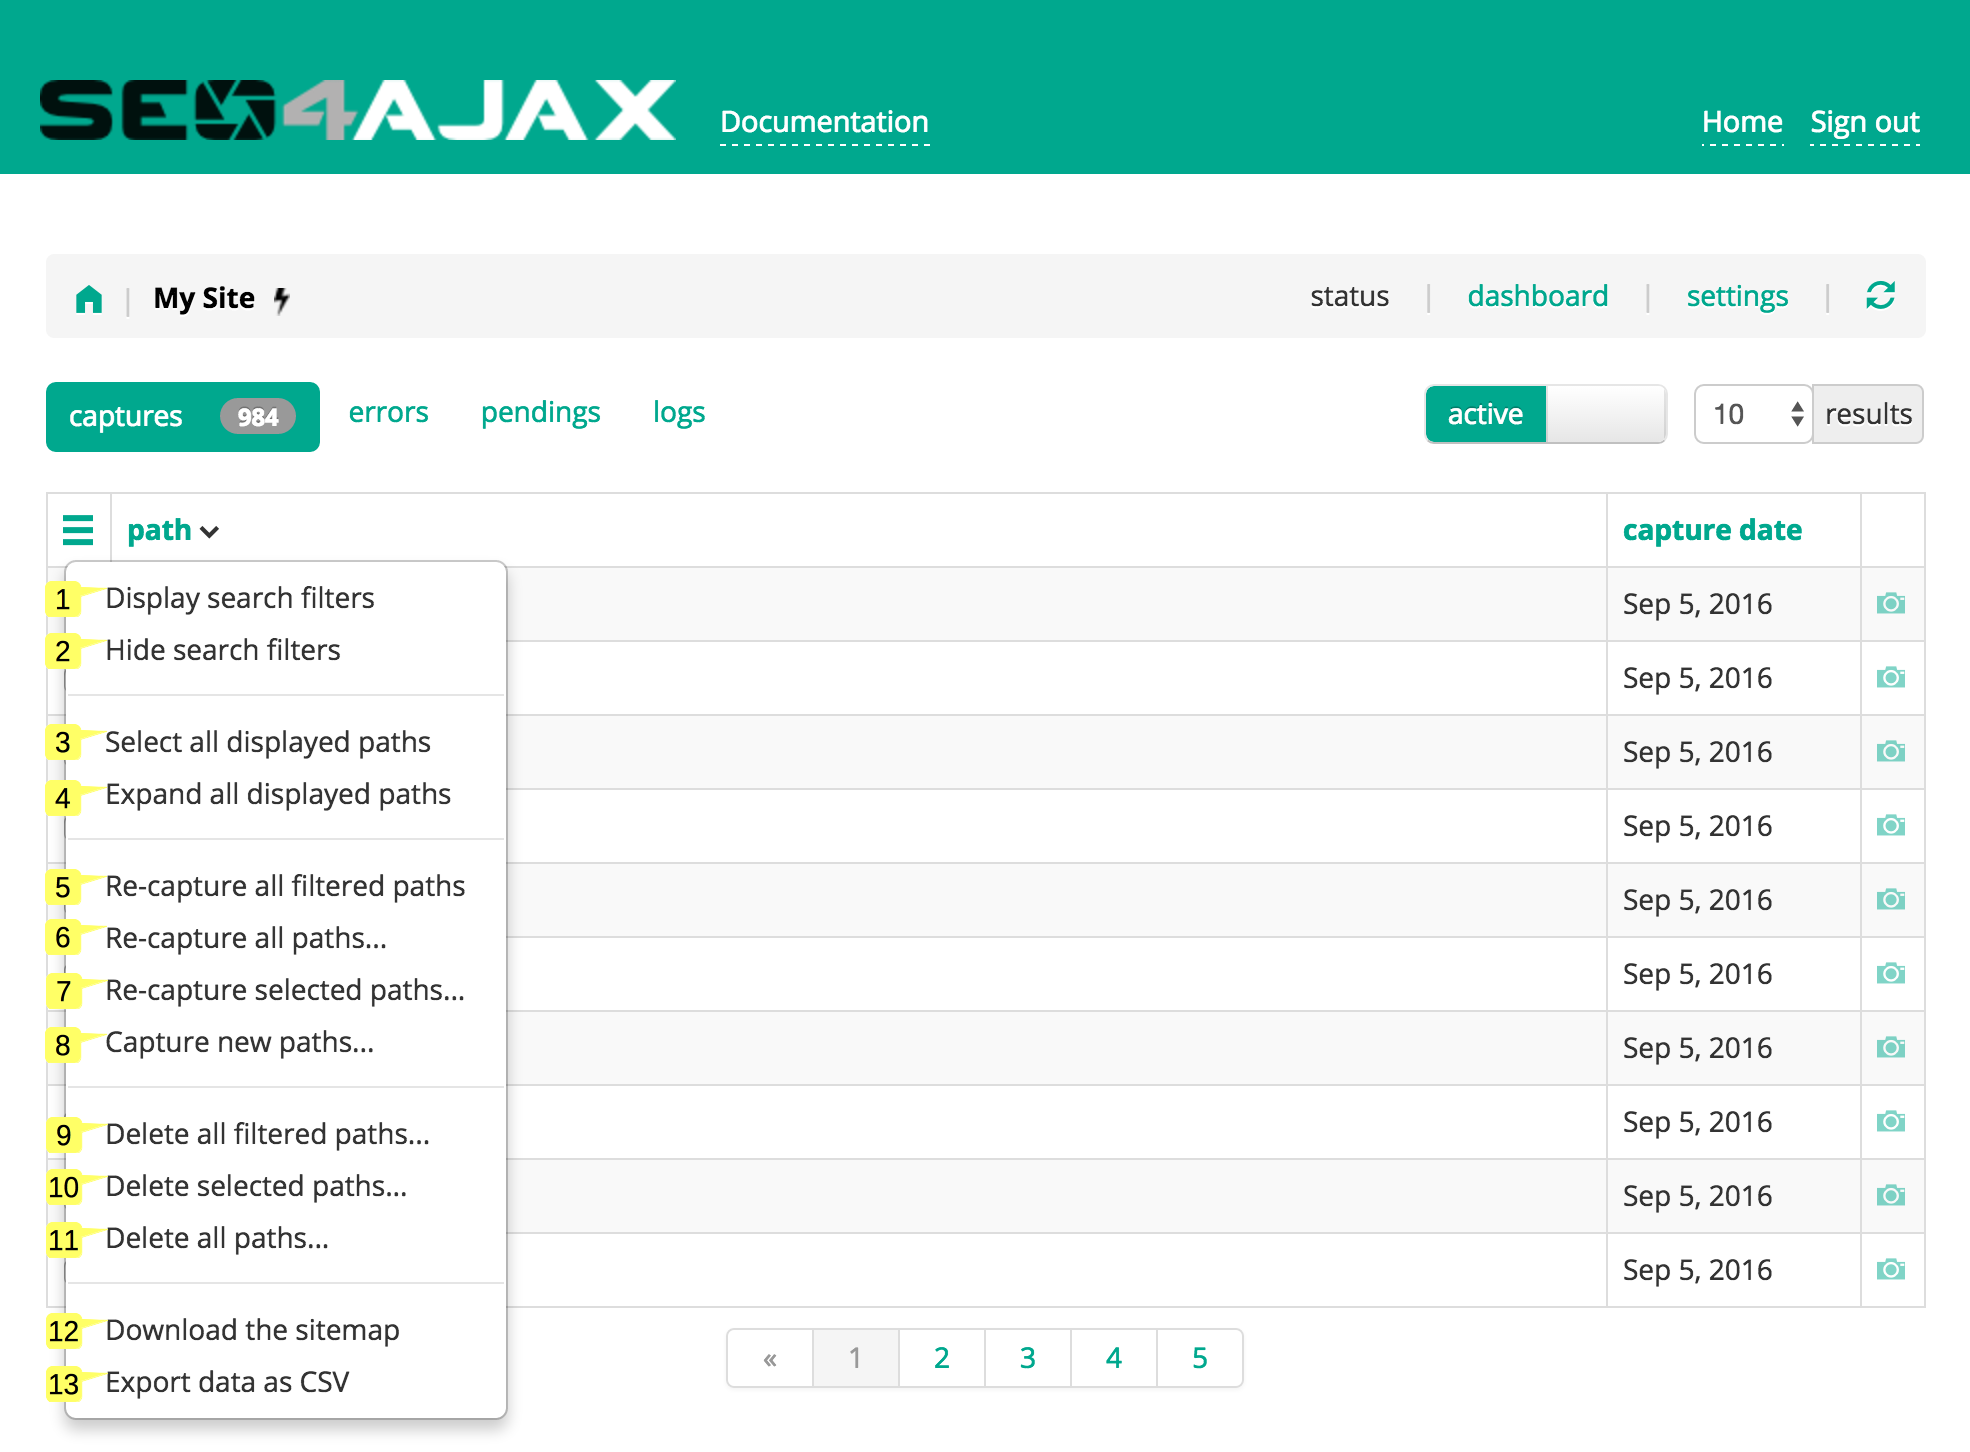
- Click on the "Display search filters" entry 1 to display the filters panel
- Click on the "Hide search filters" entry 2 to hide the filters panel
- Click on the "Select all displayed paths" entry 3 to select all checkboxes from the current status view
- Click on the "Expand all displayed paths" entry 4 to display the detail of all statuses of the current status view
- Click on the "Re-capture all filtered paths..." entry 5 to open the Capture all filtered paths popup and capture all the filtered paths
- Click on the "Re-capture all paths..." entry 6 to open the Capture all paths popup and capture all the paths
- Click on the "Re-capture selected paths..." entry 7 to open the Capture paths popup prefilled with the selected paths
- Click on the "Capture new paths..." entry 8 to open the Capture paths popup with an empty list
- Click on the "Delete all filtered paths..." entry 9 to open the Delete all filtered paths popup and delete all the filtered paths
- Click on the "Delete selected paths..." entry 10 to open the Delete selected paths popup and delete the selected paths
- Click on the "Delete all paths..." entry 11 to open the Delete all paths popup and delete all the paths
- Click on the "Download the sitemap" entry 12 to open the Download sitemap popup and download the sitemap file(s) of the site
- Click on the "Export data as CSV" entry 13 to download the complete list of captures, errors or pending captures and their related data (e.g. capture date). You can find more information here
Filters
This panel is displayed when you click on the "Display search filters" entry in the contextual menu. It allows filtering the displayed results in the current status view.
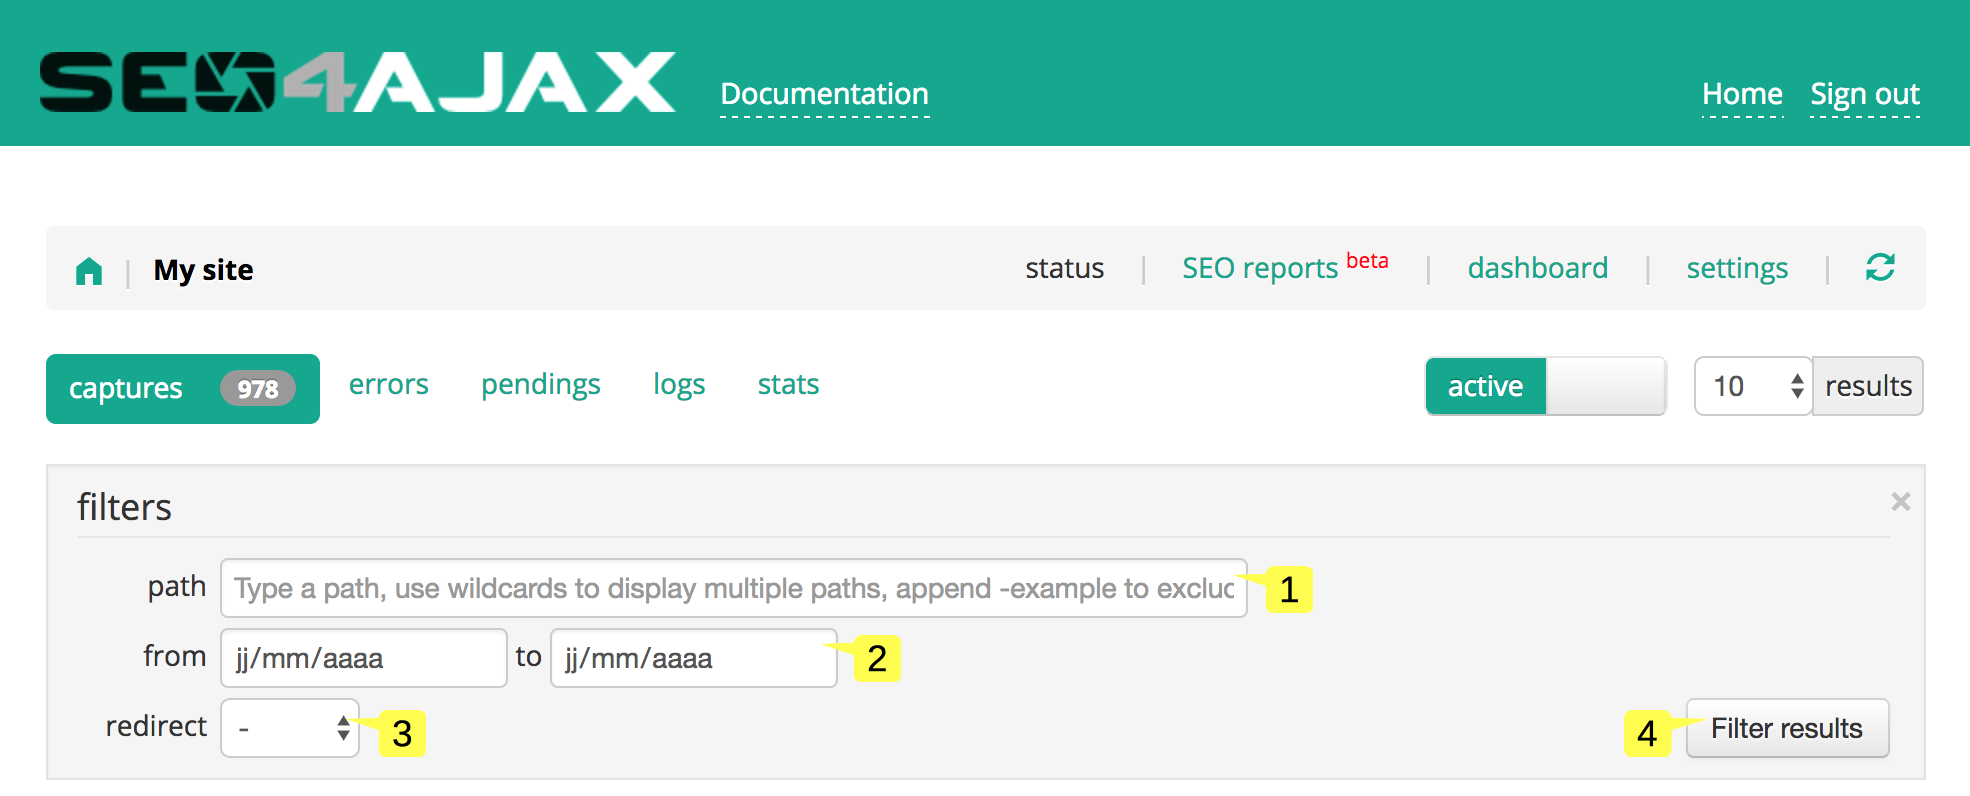
- Type a path 1 to display the corresponding results (you can use wildcards "*" and append "-example"" to exclude paths containing 'example')
- Type a date period 2 to only display the results for this period
- Choose the redirect status 3 to display the results with or without redirects
- Press the "Filter" button 4 to display the filtered results
Capture paths popup
This popup is displayed when you click on the "Re-capture selected paths..." or the "Capture new paths..." entry in the contextual menu. It allows capturing a list of paths.
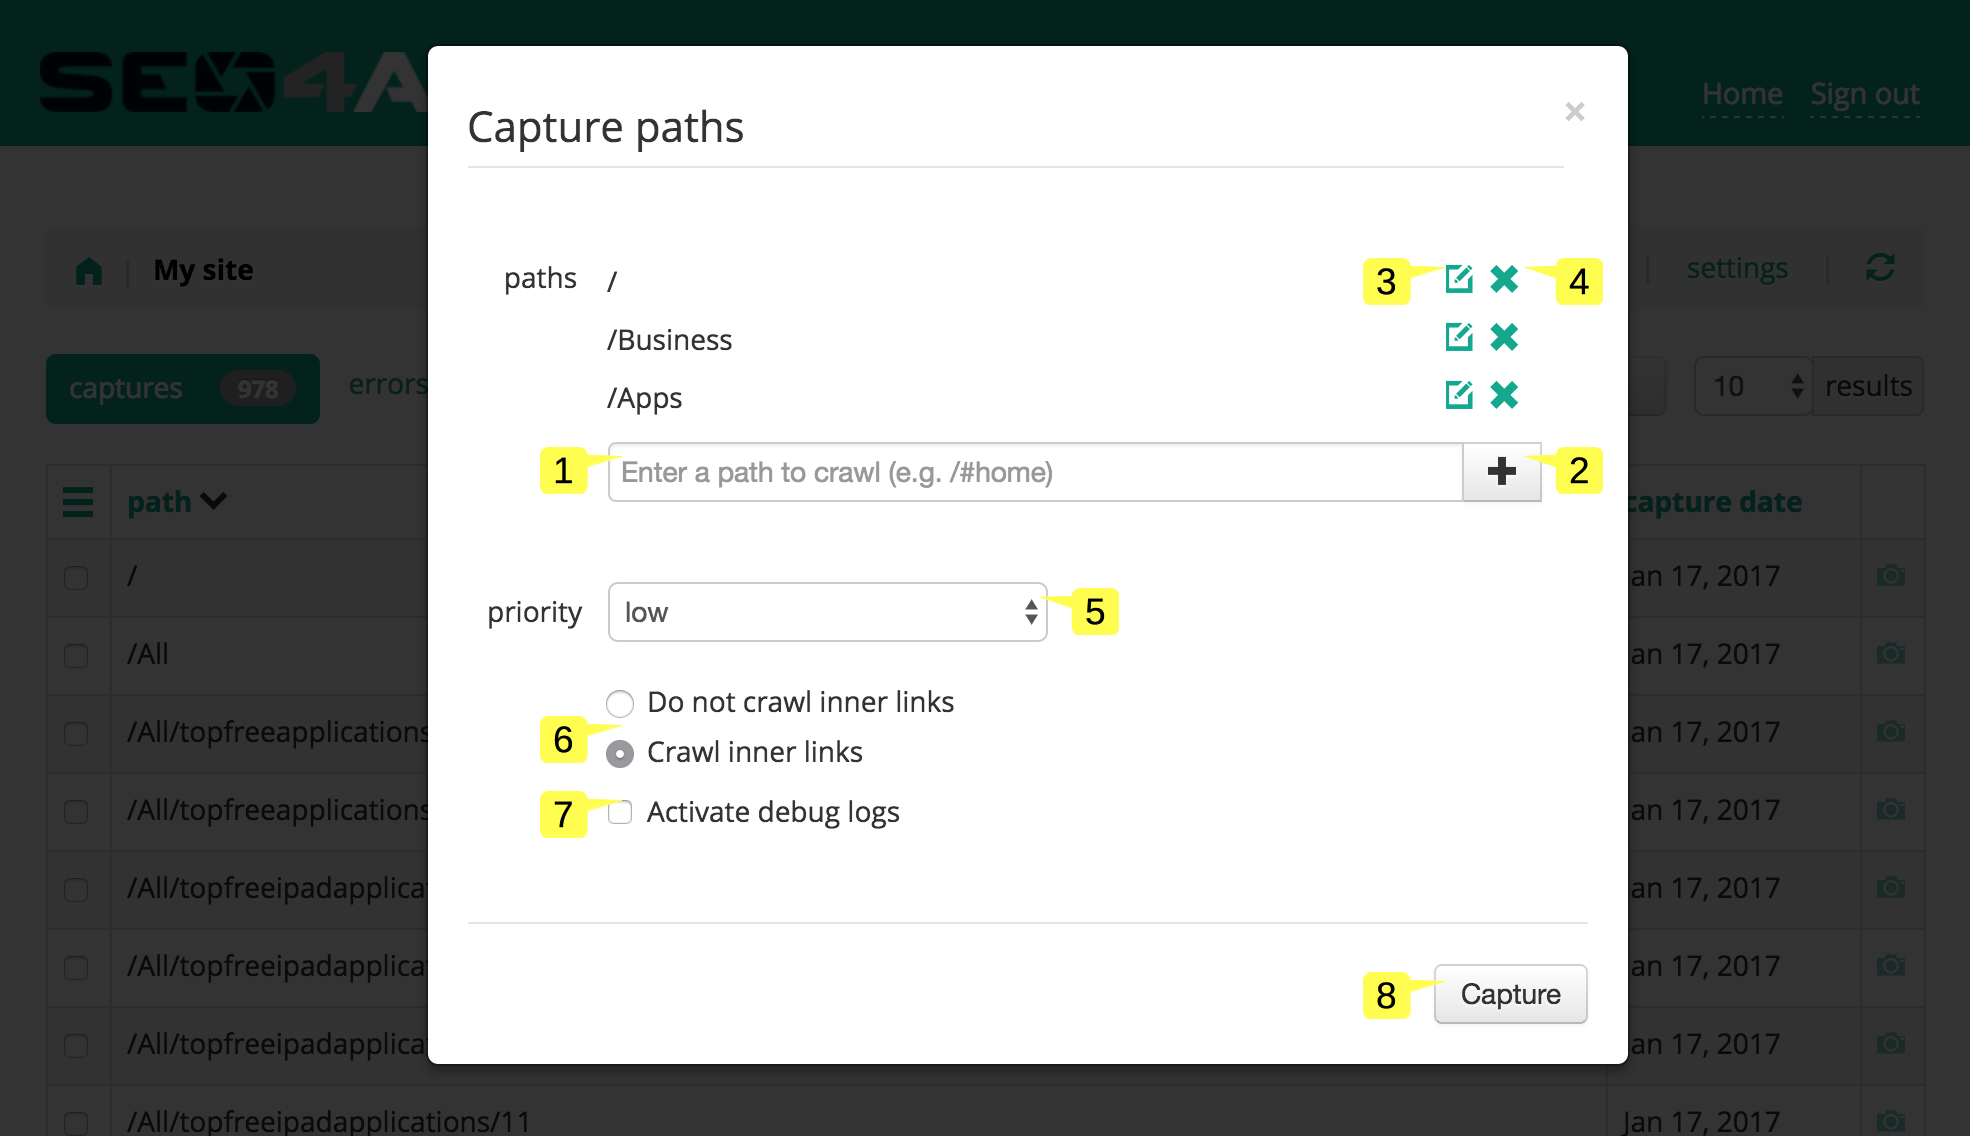
- Type a path 1 and press the "+" button 2 to add a path to capture
- Click on the edit icon 3 to edit a path
- Click on the delete icon 4 to remove a path from the list
- Select the priority 5 at which the paths should be crawled
- Select one of the following options 6 to configure the crawl:
Do not crawl descendant pathsoption captures only the paths in the listCrawl descendant pathsoption captures paths in the list and all the inner links
- Check the "activate debug logs" option 7 to save debug logs for these paths, the logs can be viewed in the logs view
- Press the "Capture" button 8 to confirm the action
Capture all filtered paths popup
This popup is displayed when you click on the "Re-capture all filtered paths..." entry in the contextual menu.
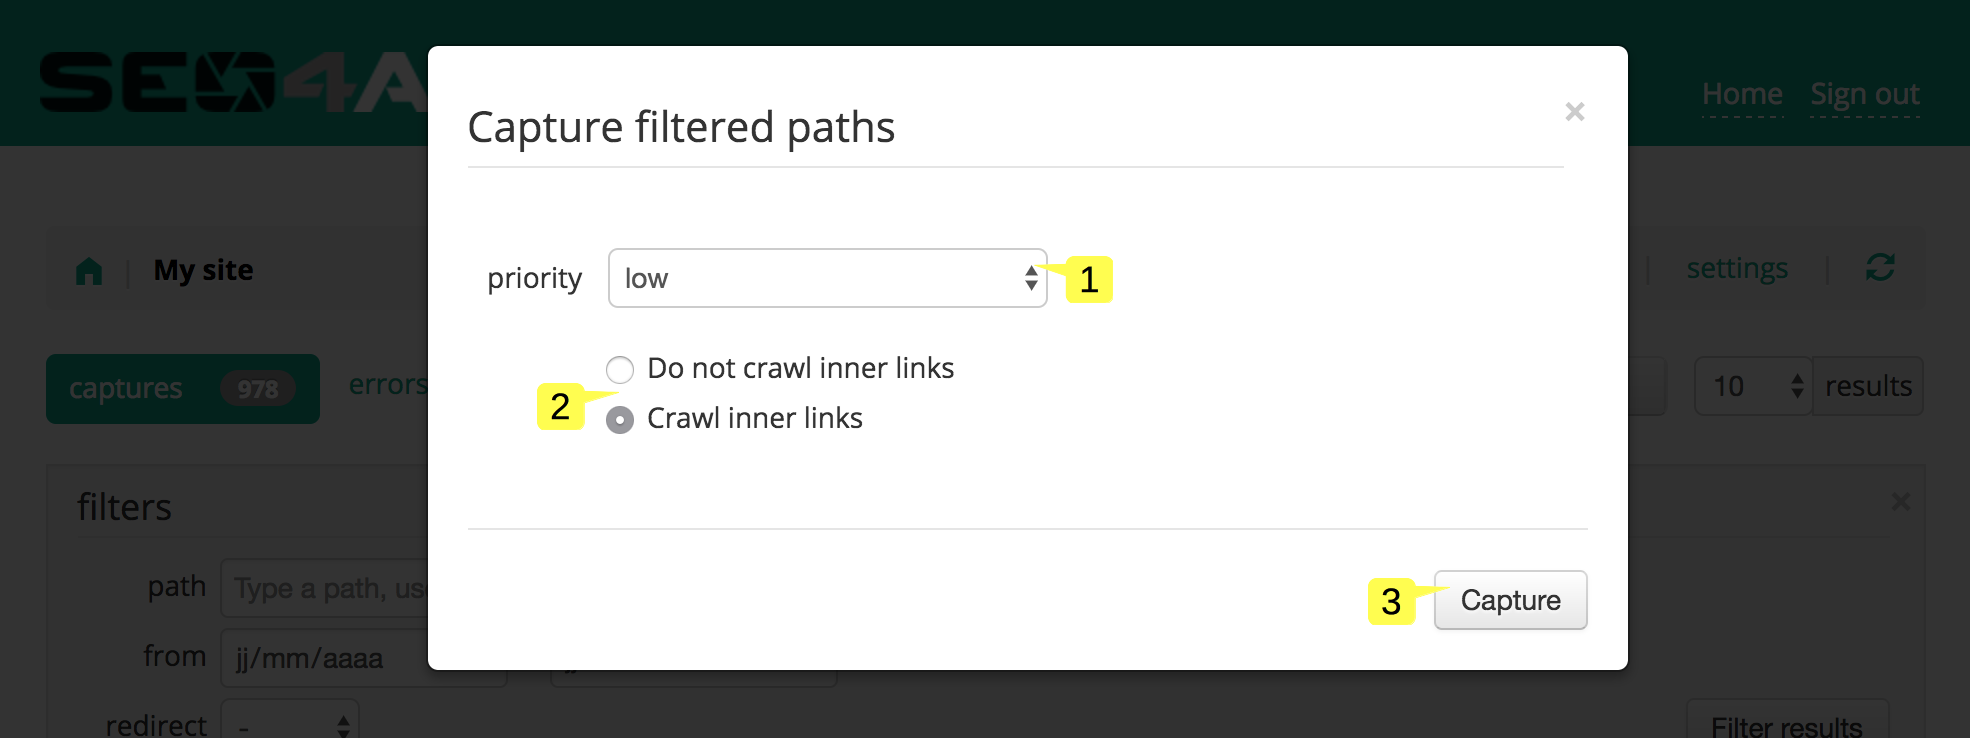
- Select the priority 1 at which the paths should be crawled
- Select one of the following options 2 to configure the crawl:
Do not crawl descendant pathsoption captures only all the paths from the "captures" viewCrawl descendant pathsoption captures all the paths from the "captures" view and all the inner links
- Press the "Capture" button 3 to confirm the action
Capture all paths popup
This popup is displayed when you click on the "Re-capture all paths..." entry in the contextual menu.
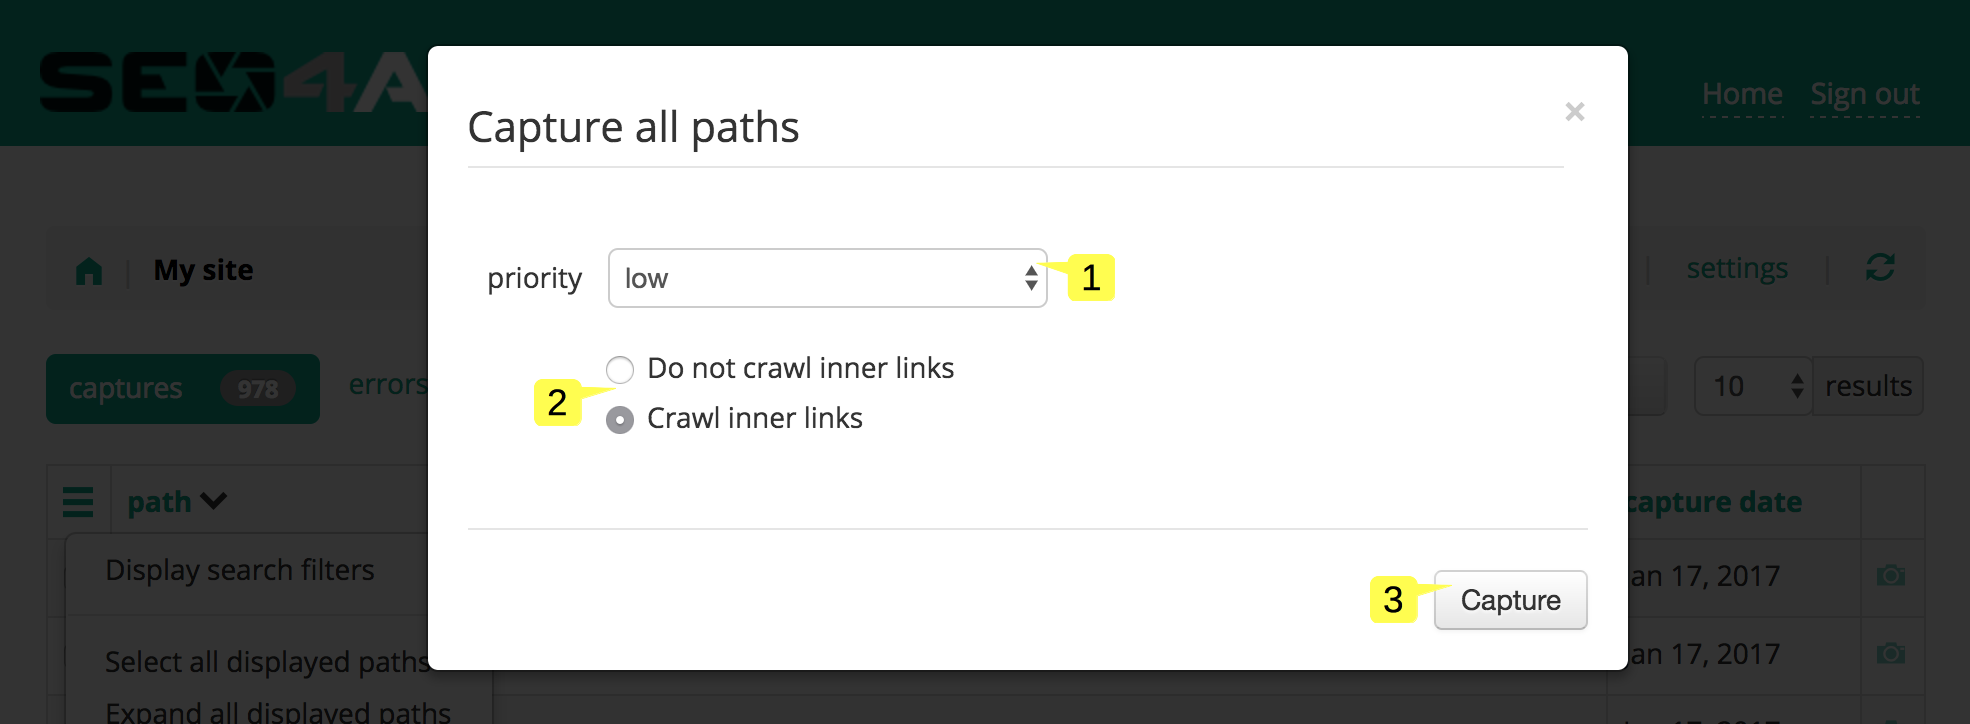
- Select the priority 1 at which the paths should be crawled
- Select one of the following options 2 to configure the crawl:
Do not crawl descendant pathsoption captures only all the paths from the "captures" viewCrawl descendant pathsoption captures all the paths from the "captures" view and all the inner links
- Press the "Capture" button 3 to confirm the action
Delete selected paths popup
This popup is displayed when you click on the "Delete selected paths..." entry in the contextual menu.
- Press the "Cancel" button 1 to cancel the action and close the popup
- Press the "Confirm" button 2 to confirm the action
Delete all filtered paths popup
This popup is displayed when you click on the "Delete all filtered paths..." entry in the contextual menu.
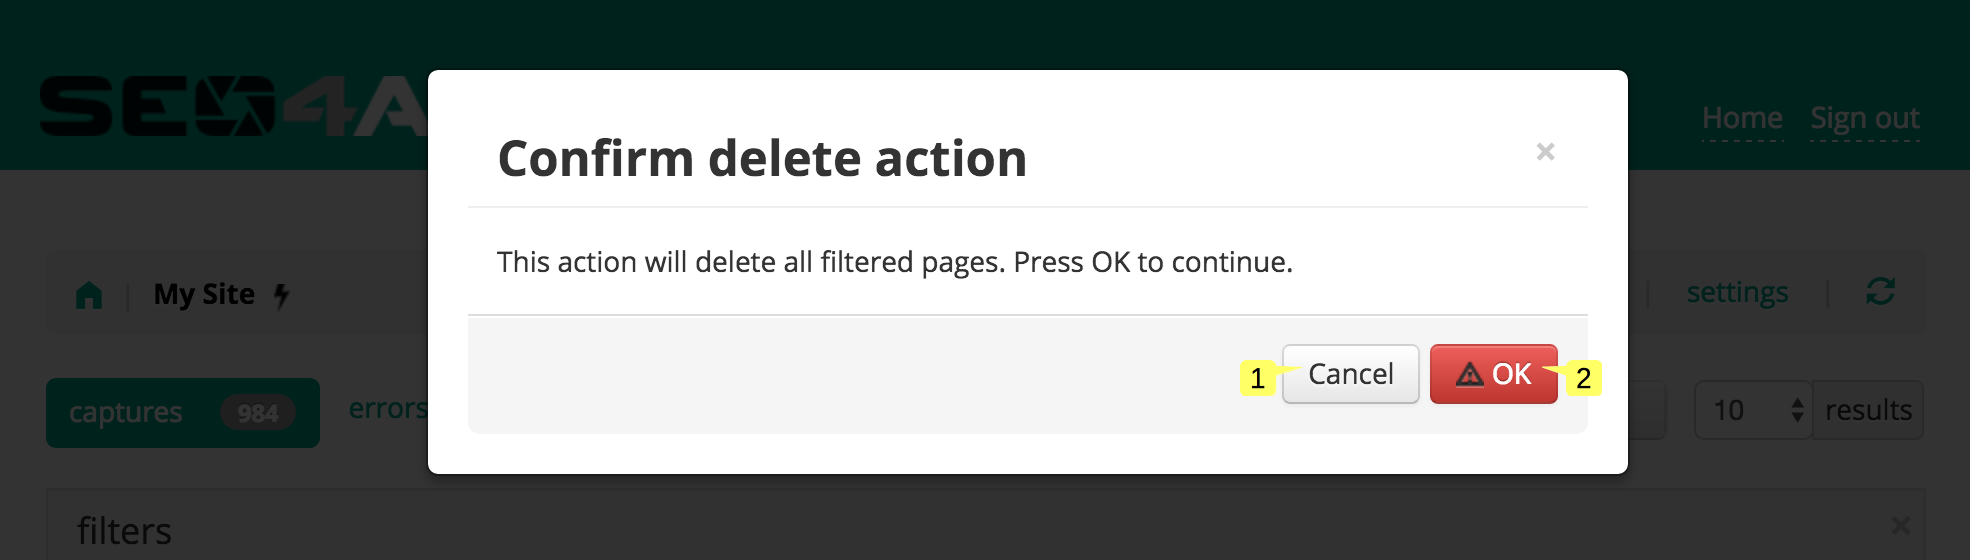
- Press the "Cancel" button 1 to cancel the action and close the popup
- Press the "Confirm" button 2 to confirm the action
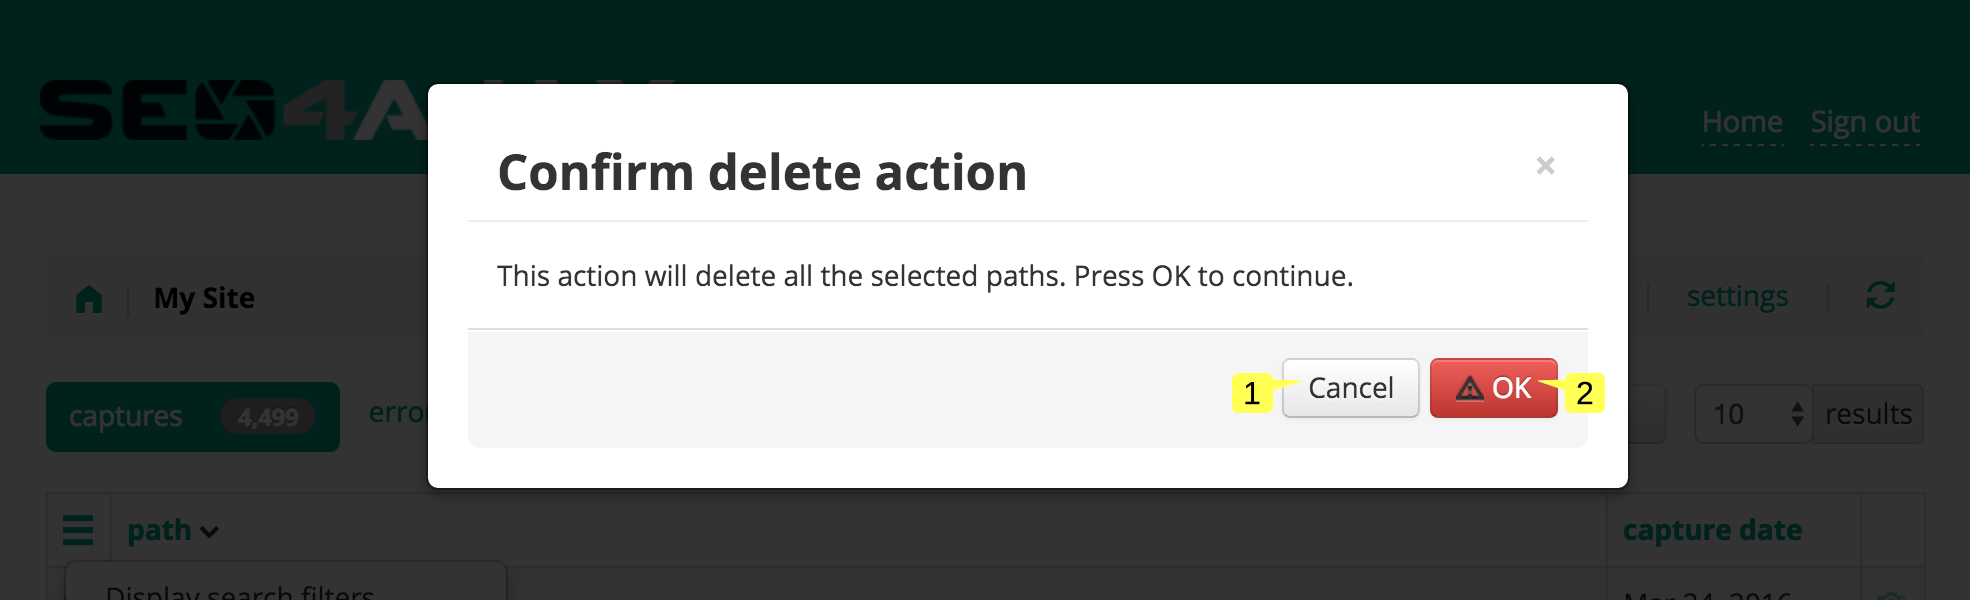
Delete all paths popup
This popup is displayed when you click on the "Delete all paths..." entry in the contextual menu.

- Press the "Cancel" button 1 to cancel the action and close the popup
- Press the "Confirm" button 2 to confirm the action
Download sitemap popup
This popup is displayed when you click on the "Download the sitemap" entry in the contextual menu.
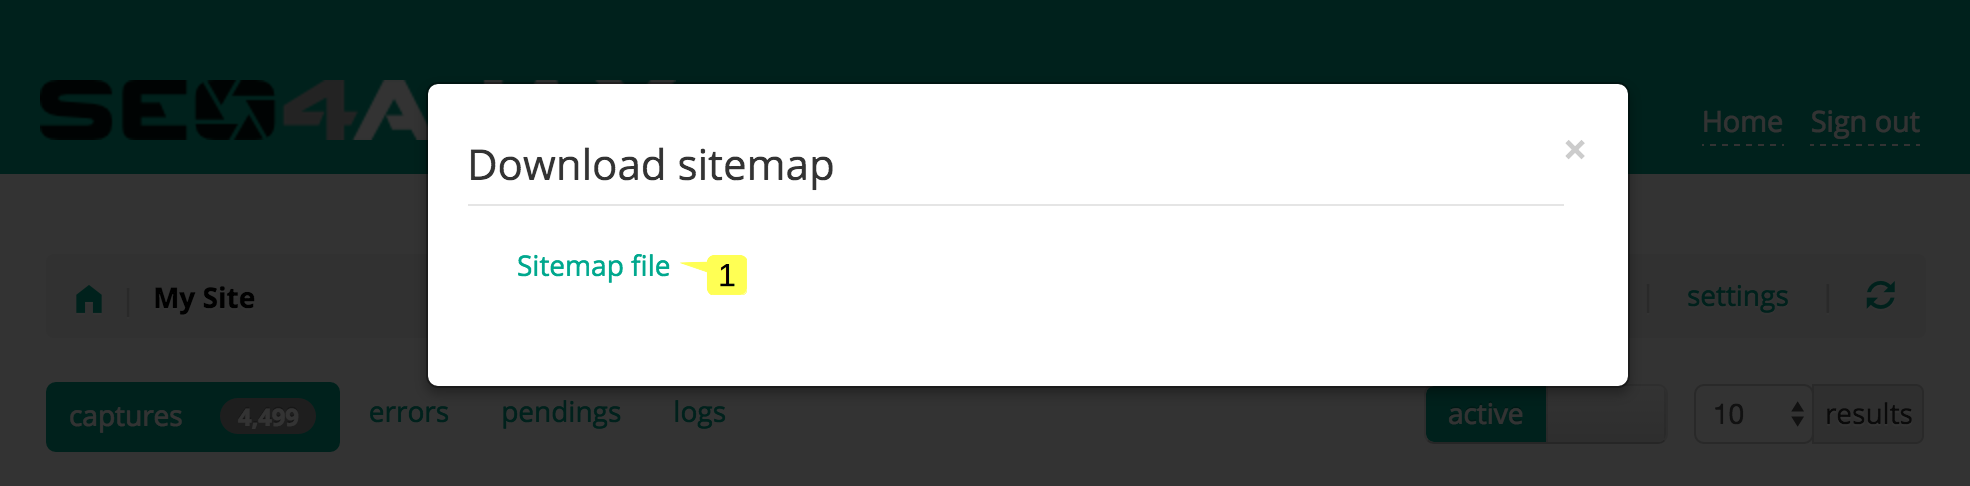
- Click on the link(s) 1 to download the sitemap file(s)
Site SEO reports
Refreshed twice a day, the SEO reports aim to give you hints about technical SEO issues which may affect your website.
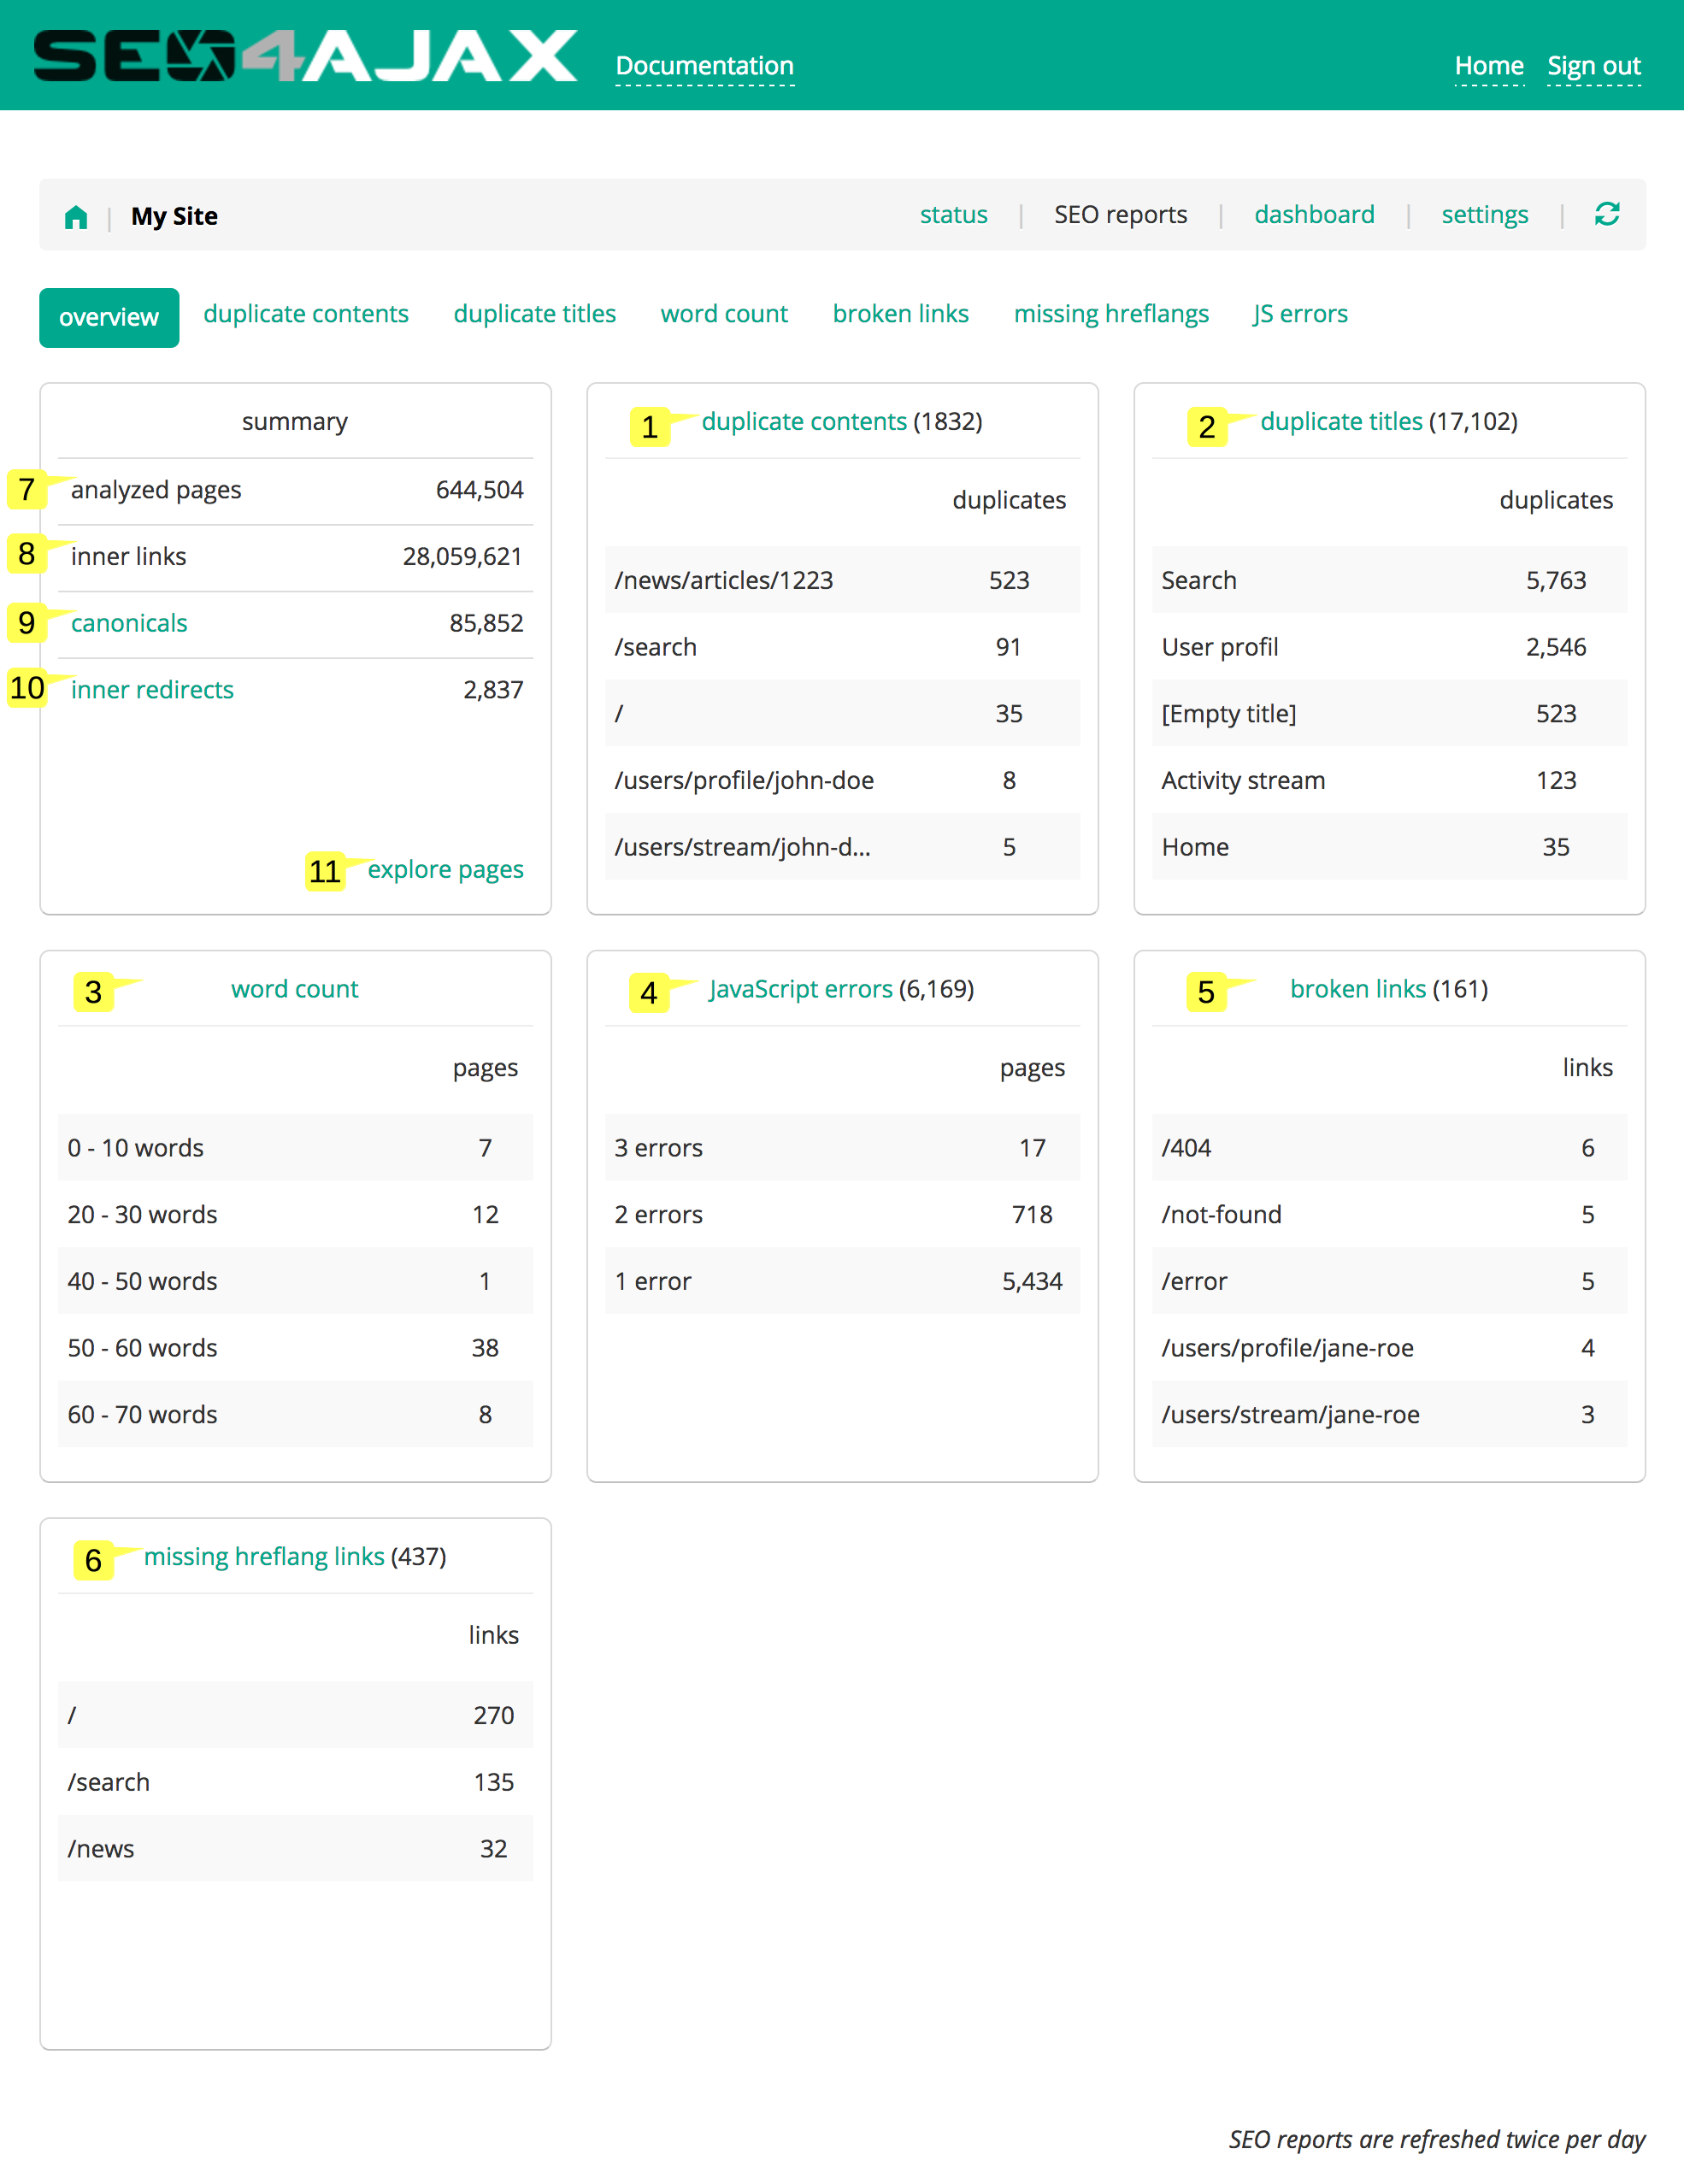
The monitored metrics are:
- Duplicate contents 1
- Duplicate titles 2
- Word count 3
- JavaScript errors 4
- Broken links 5
- Missing hreflang links 6
In addition to the summaries for each of the monitored metrics, the overview displays information about the structure of your website through the number of:
- analyzed pages 7
- inner links 8
- pages having a canonical link 9
- inner redirects 10
It also gives you access to the page explorer 11. For each path, this explorer gives you details about:
- The HTTP status returned to bots
- The page title
- The inner canonical path, if any
- Links to other pages in the website, if any
- Pages referencing this path (i.e. referrers), if any
Duplicate contents
Duplicate contents refer to two or more pages having the same text content in their body tag. Contents of pages linked through <link rel="canonical" href="..."> or <link rel="alternate" hreflang="..." href="..."> tags are not considered as duplicate.
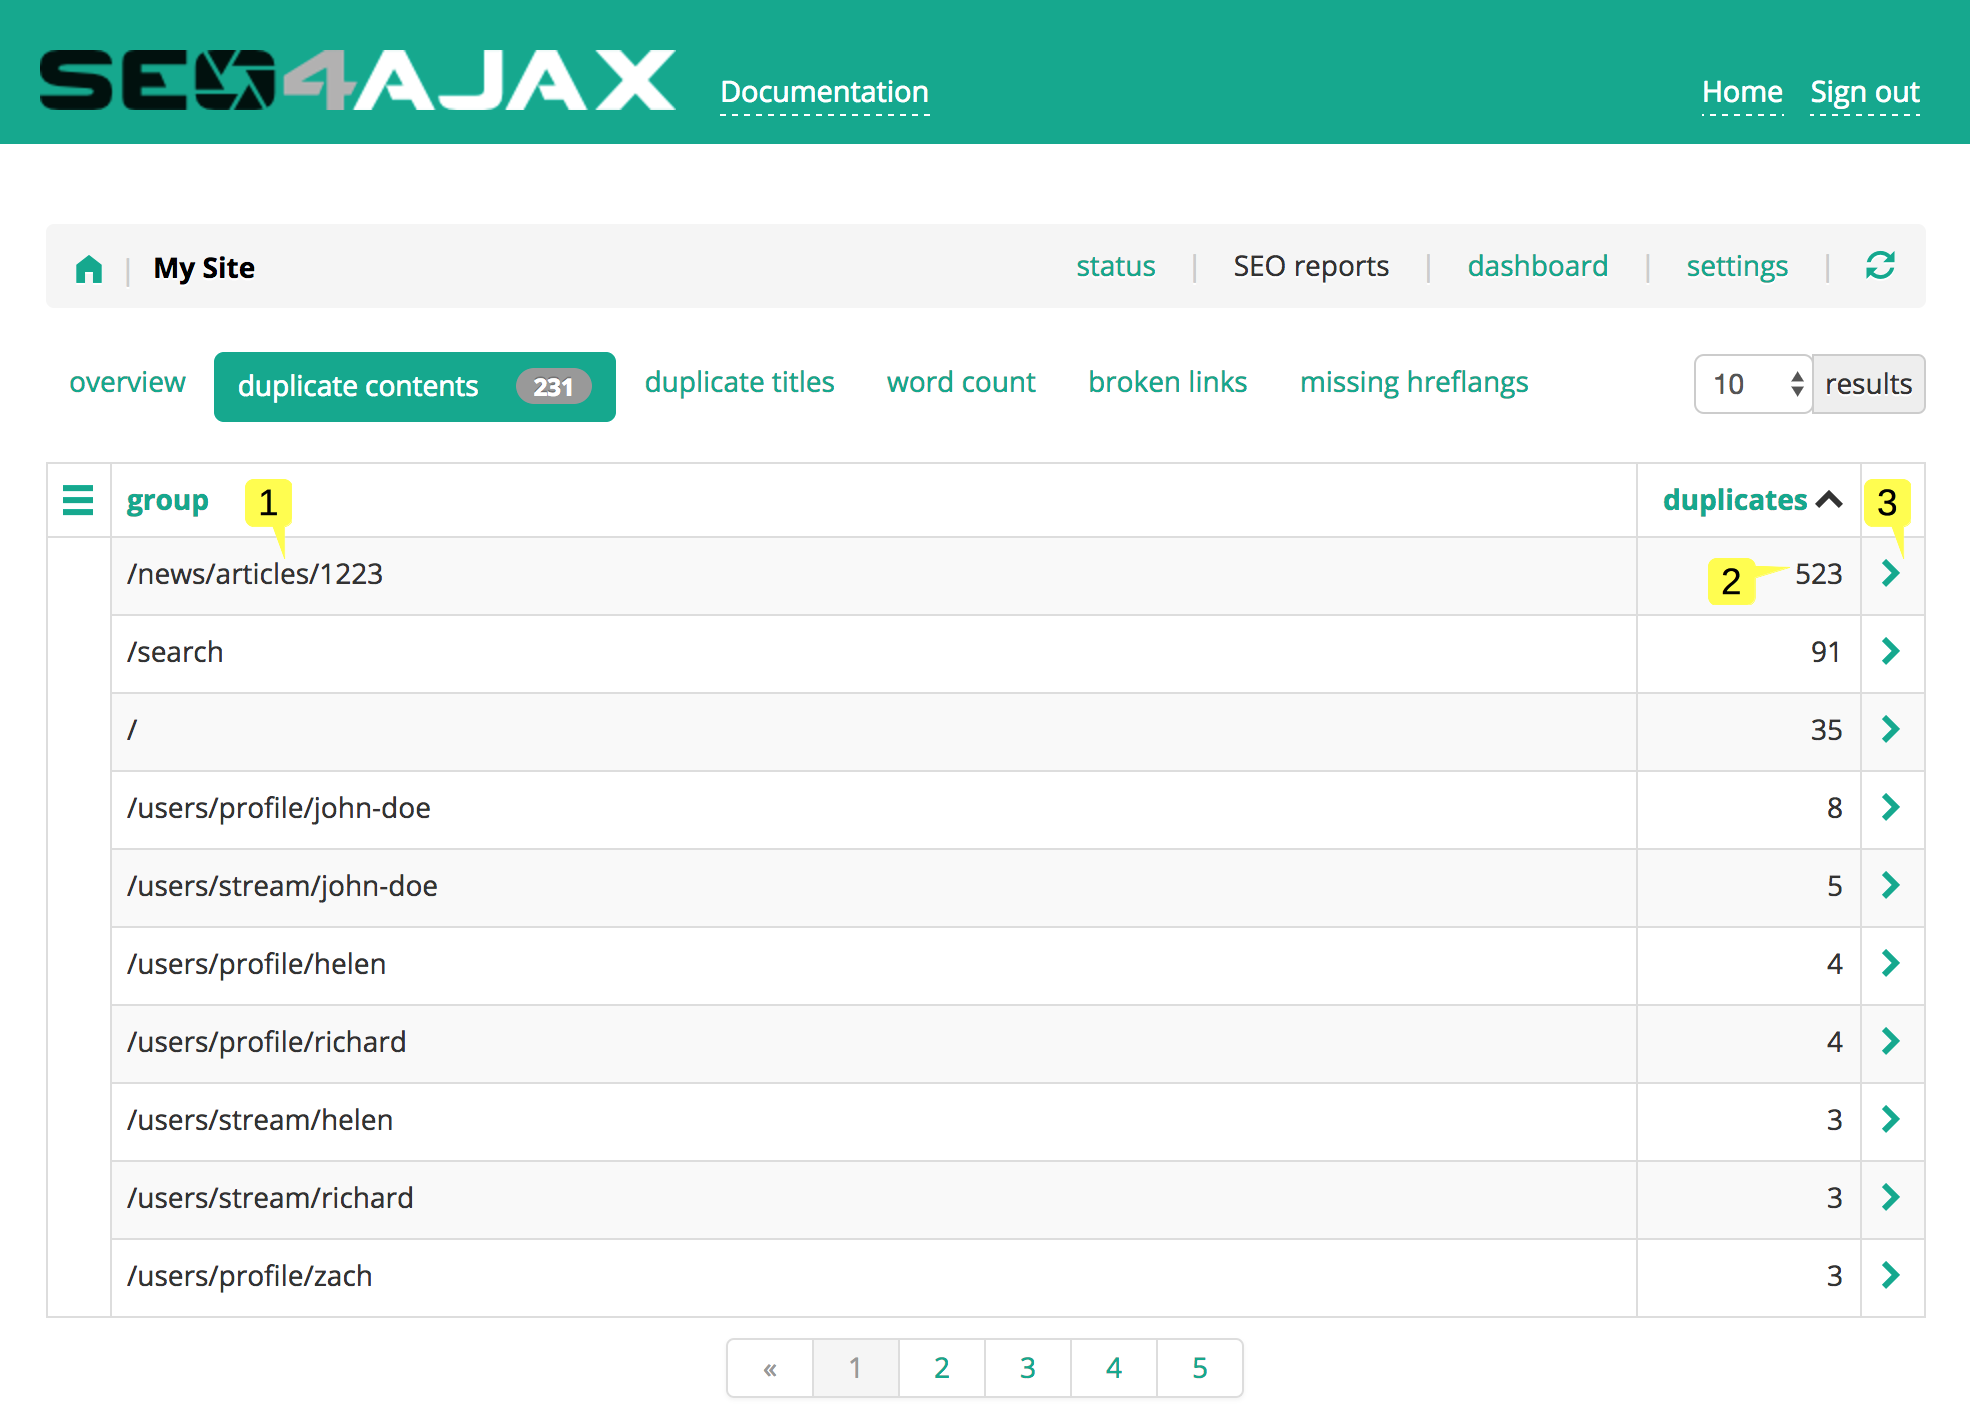
This view lists groups of duplicate contents, identified by the path of a page from each group 1, and displays the number of duplicates in each group 2. The list of pages having the same content is displayed when clicking on the right arrow 3.
Duplicate contents are often due to:
- Useless query parameter, e.g. utm_* tracking parameters
- Unmanaged soft 404
- Case sensitivity issue, e.g. example.com/home and example.com/HOME are two different URLs
To fix these issues you can respectively:
- Add proper
<link rel="canonical" href="...">tags or configure a rewrite rule to either ignore useless query parameters or redirect bots to URLs without these query parameters - Use any of the Page Capture Hooks exposed by the SEO4Ajax crawler allowing the detection of soft 404
- Add proper
<link rel="canonical" href="...">tags or configure a rewrite rule to force the SEO4Ajax crawler to rewrite paths in lowercase (cf. [D] flag).
Duplicate titles
Duplicate titles refer to two or more pages having the same content in their title tag, or no content at all (identified by the string "[empty title]"). Pages linked through <link rel="canonical" href="..."> or <link rel="alternate" hreflang="..." href="..."> tags are not considered as duplicate titles.
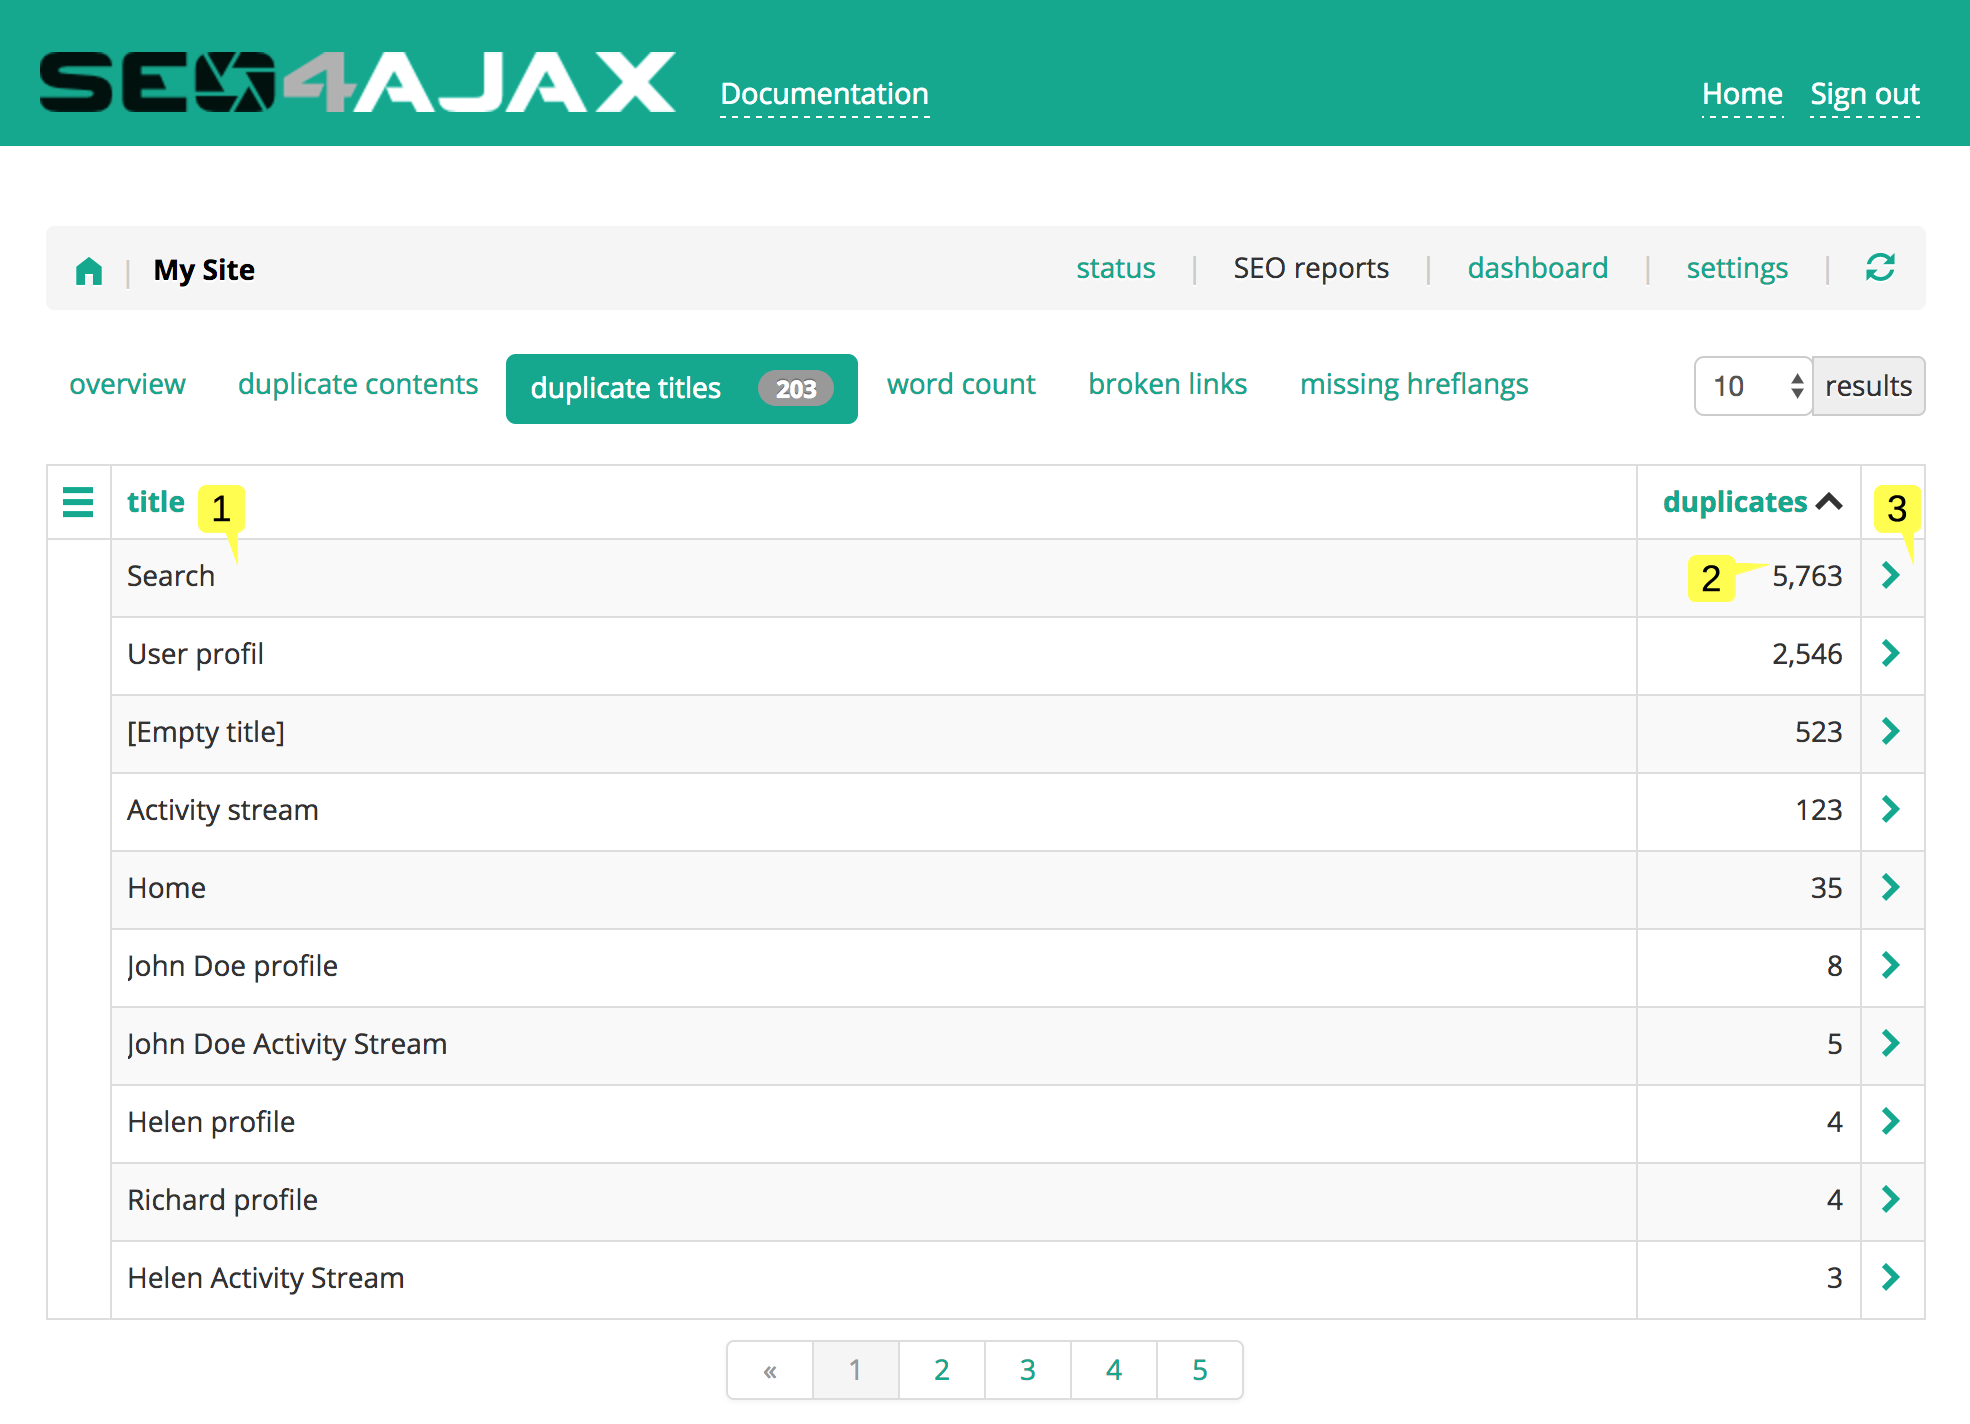
This view lists the groups of duplicate titles 1 and displays the number of pages in each group 2. The list of pages having the same title is displayed when clicking on the right arrow 3.
Duplicate titles are often due to:
- Useless query parameter, e.g. utm_* tracking parameters
- Unmanaged soft 404
- Case sensitivity issue, e.g. example.com/home and example.com/HOME are two different URLs
To fix these issues you can respectively:
- Add proper
<link rel="canonical" href="...">tags or configure a rewrite rule to either ignore useless query parameters or redirect bots to URLs without these query parameters - Use any of the Page Capture Hooks exposed by the SEO4Ajax crawler allowing the detection of soft 404
- Add proper
<link rel="canonical" href="...">tags or configure a rewrite rule to force the SEO4Ajax crawler to rewrite paths in lowercase (cf. [D] flag).
Pages with low word count
Word count refers to the number of words present in the body tag of a page.
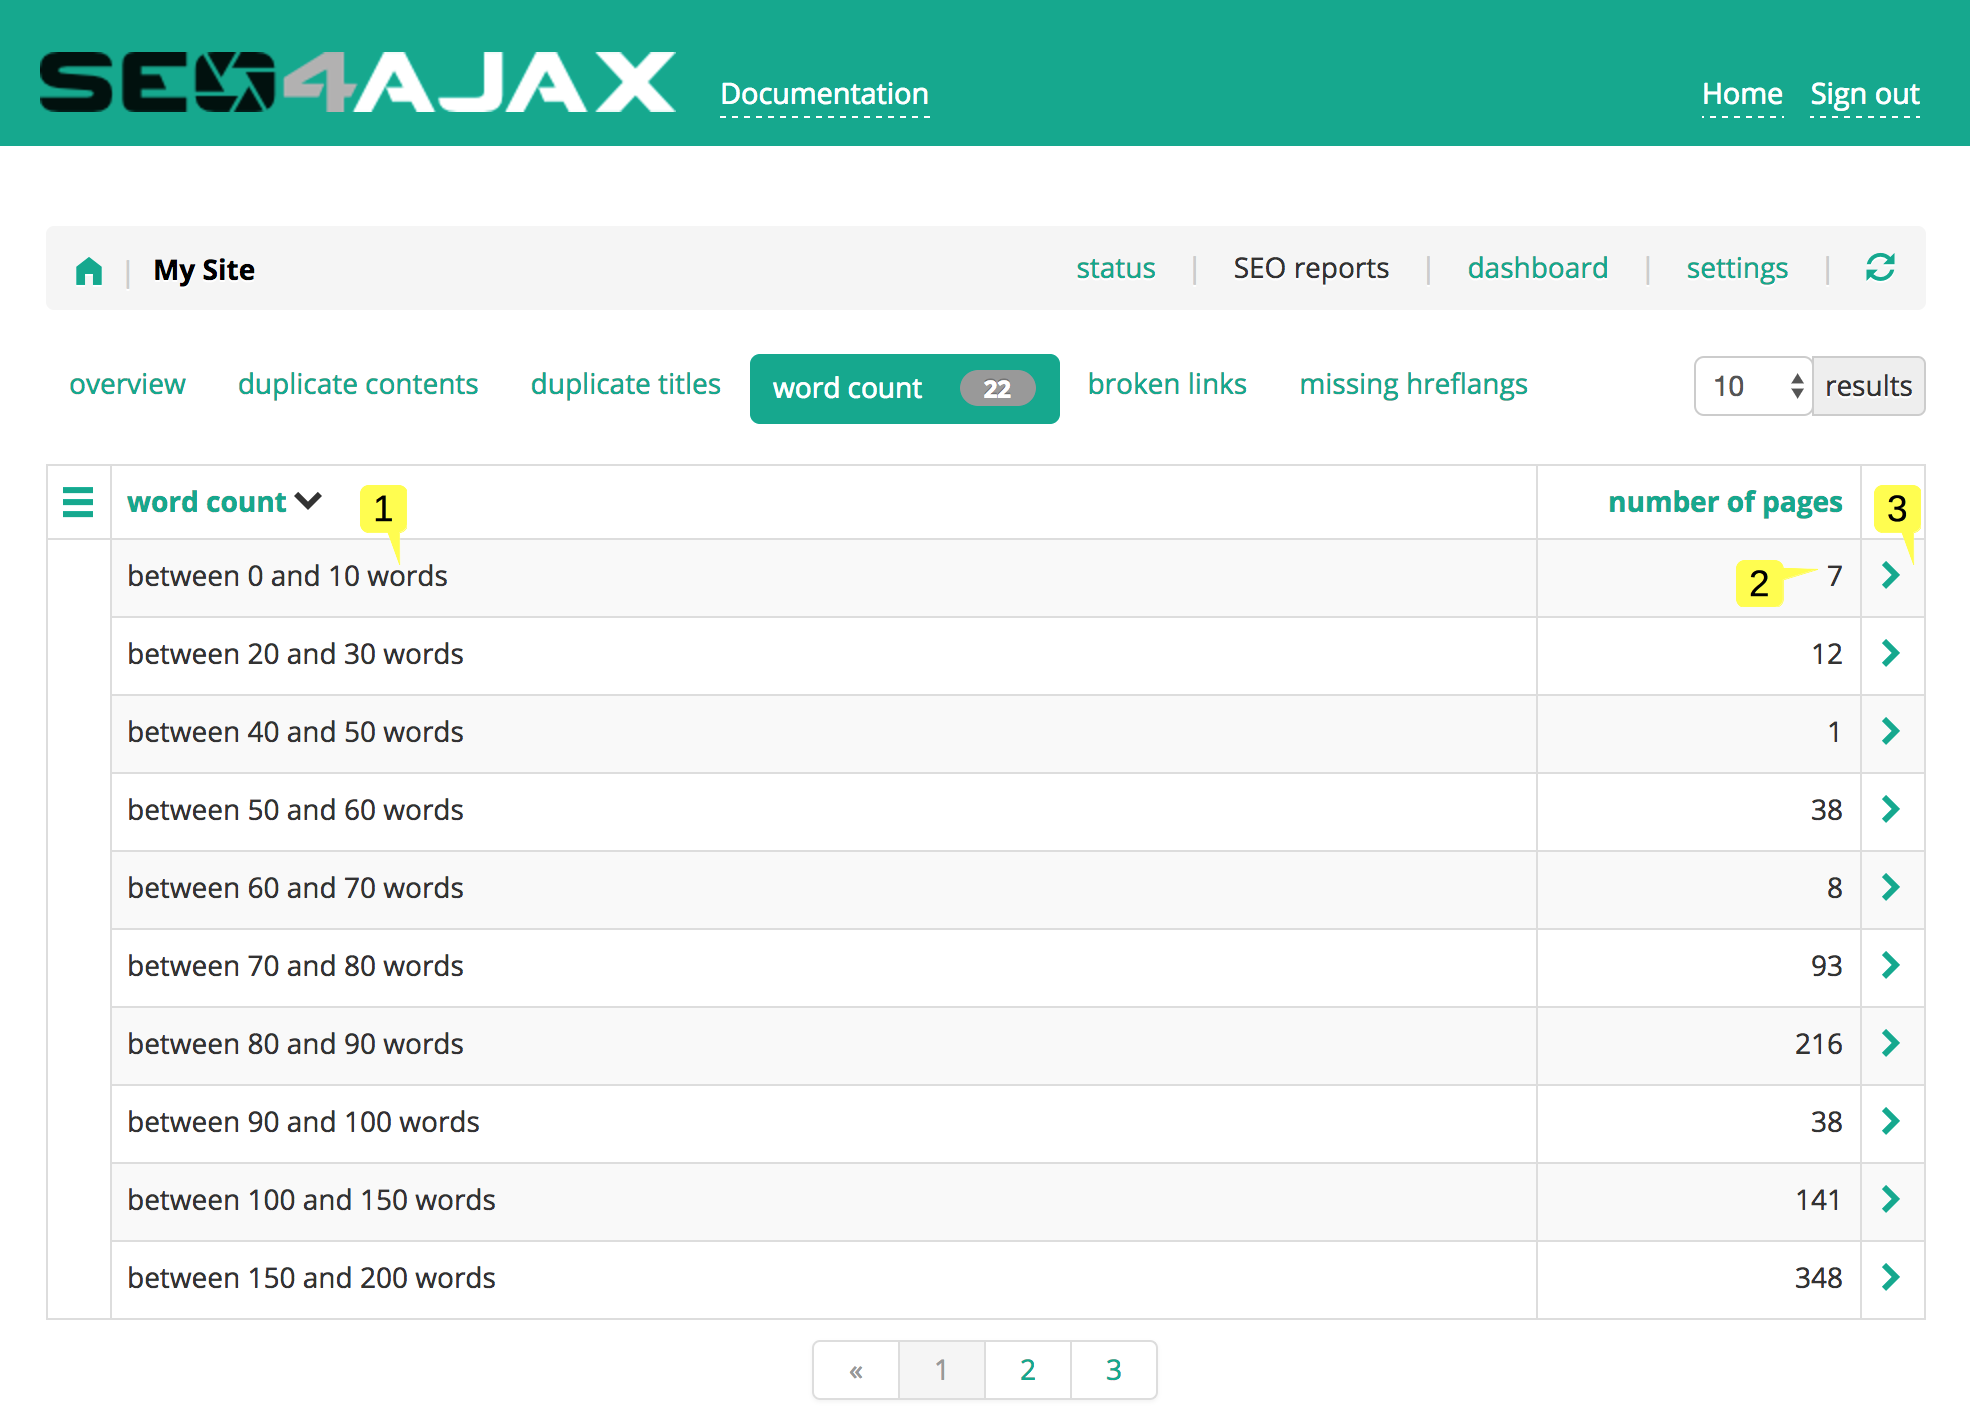
This view displays groups of words number 1 and the number of pages in each group 2. The list of pages for a given group is displayed when clicking on the right arrow 3.
A low word count for a page may indicate there is an issue on this page. Low word counts are often due to:
- Unmanaged soft 404
- Pages displaying only media content (e.g. images or videos)
- JavaScript issue preventing the content to be correctly rendered
For the first case, you can fix the issue by using any of the Page Capture Hooks exposed by the SEO4Ajax crawler allowing the detection of soft 404.
JavaScript errors
JavaScript errors refer to pages having at least one JavaScript error raised during the capture process. A JavaScript error on a page may indicate there is a rendering issue on this page.
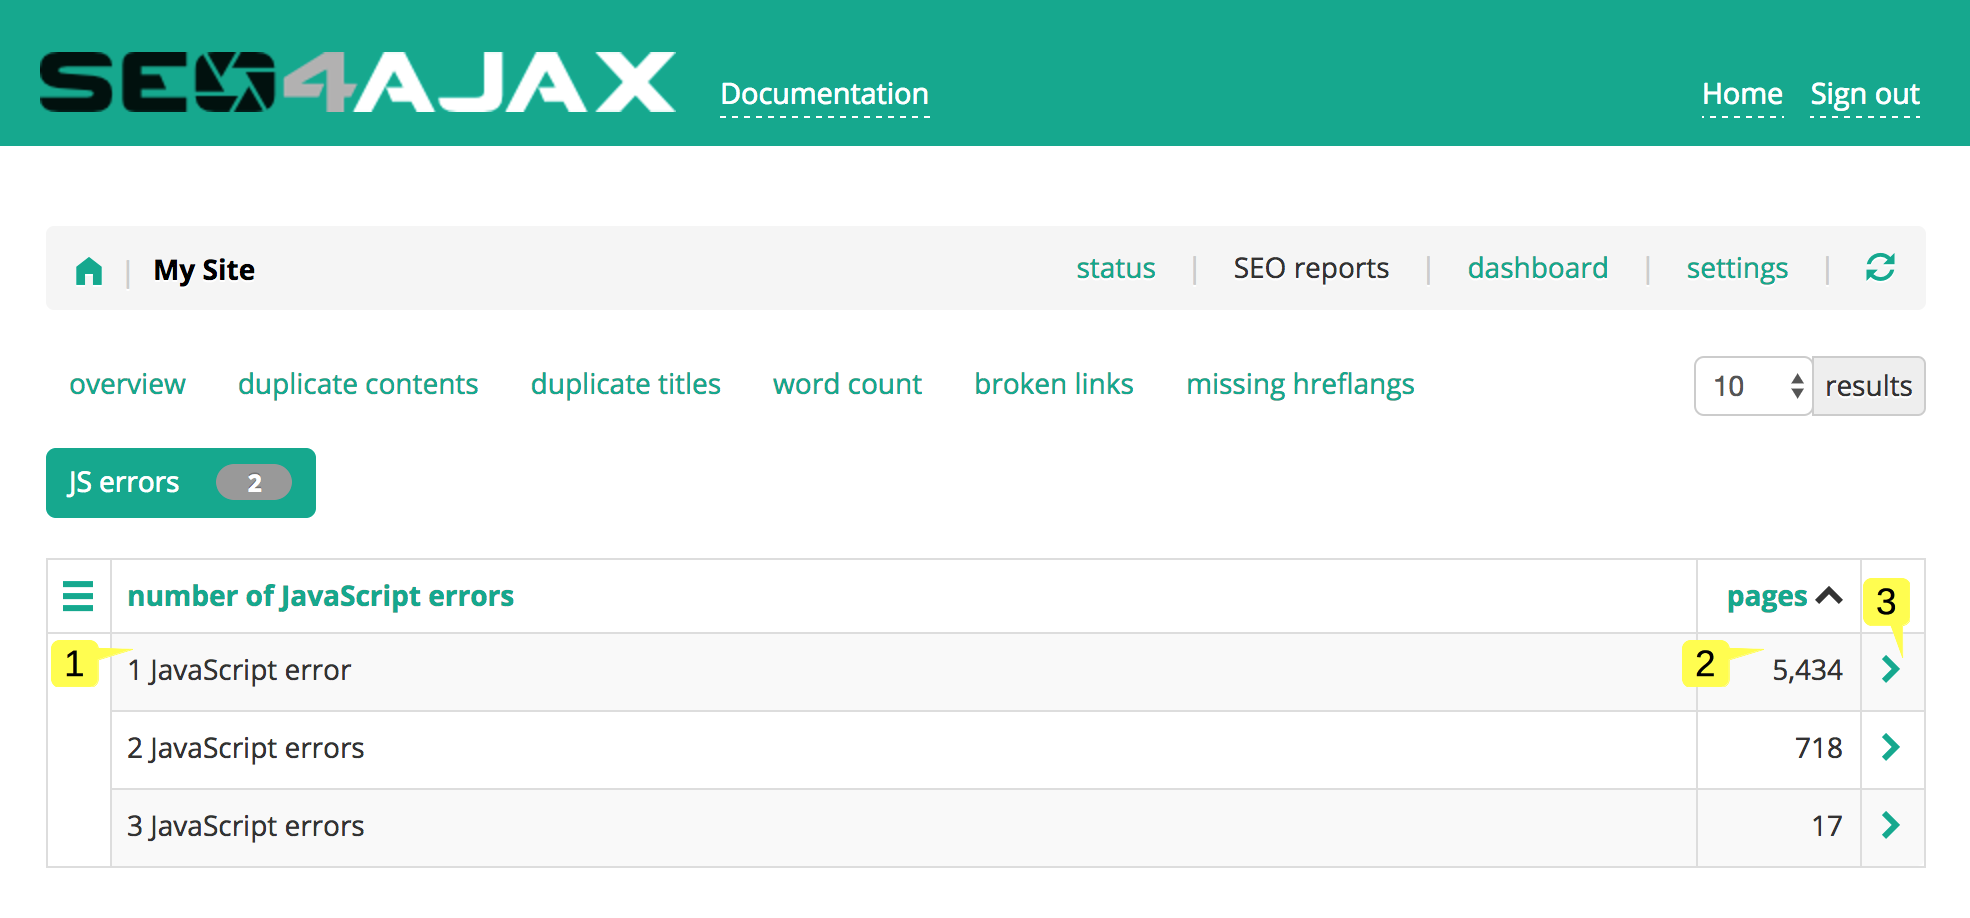
This view lists the groups of pages by number of JavaScript errors 1 and displays the number of pages in each group 2. The list of pages having the same number of JavaScript errors is displayed when clicking on the right arrow 3.
Broken links
Broken links refer to inner links pointing to pages detected as 4xx errors by the SEO4Ajax crawler (401, 402, 403, 407 and 499 codes are ignored). These links can be either <a href="...">, <link rel="alternate" hreflang="..." href="...">, <link rel="prev" href="..."> or <link rel="next" href="..."> tags.
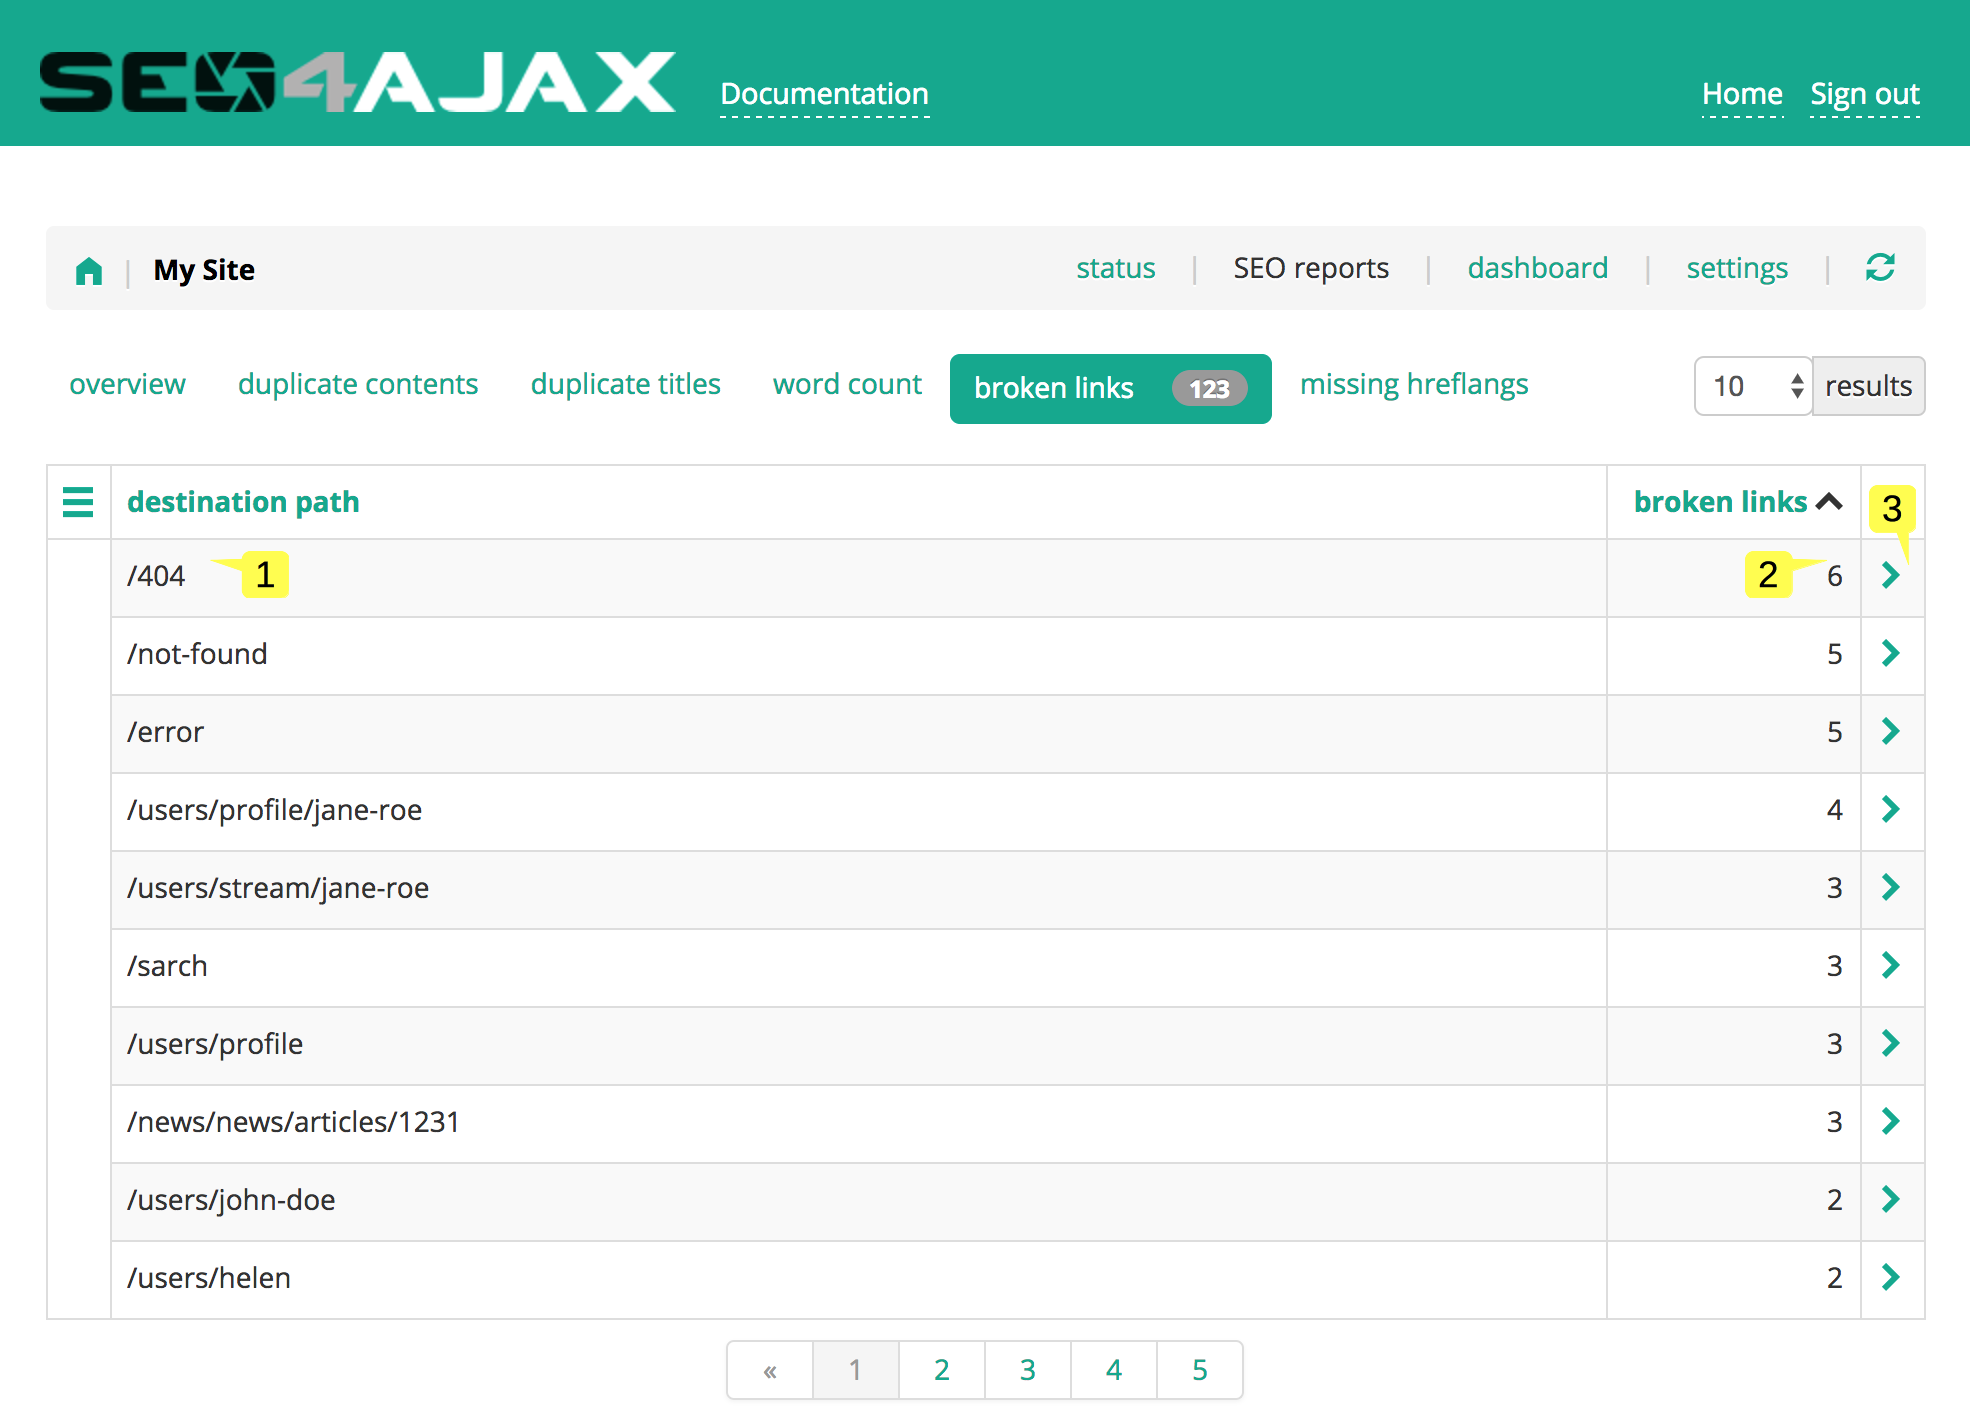
This view lists the destination pages of broken links 1 and the number of source pages having at least one broken link 2. The list of source pages for a given destination page is displayed when clicking on the right arrow 3.
Broken links are often due to:
- Removed pages that are still linked from other pages
- Invalid external links (e.g.
<a href="external.example.com">instead of<a href="http://external.example.com">) - JavaScript issue when generating links (e.g. links generated with a double slash)
Missing hreflang links
The <link rel="alternate" hreflang="..." href="..."> tag allows to indicate to bots that the content of a page is available for alternate languages and/or regions. As specified in the Google documentation, for each page pointing to another through a hreflang link, this second page must point to the former one through a hreflang link (also called a confirmation link). Missing hreflang links refer to pages where at least one confirmation link is missing.
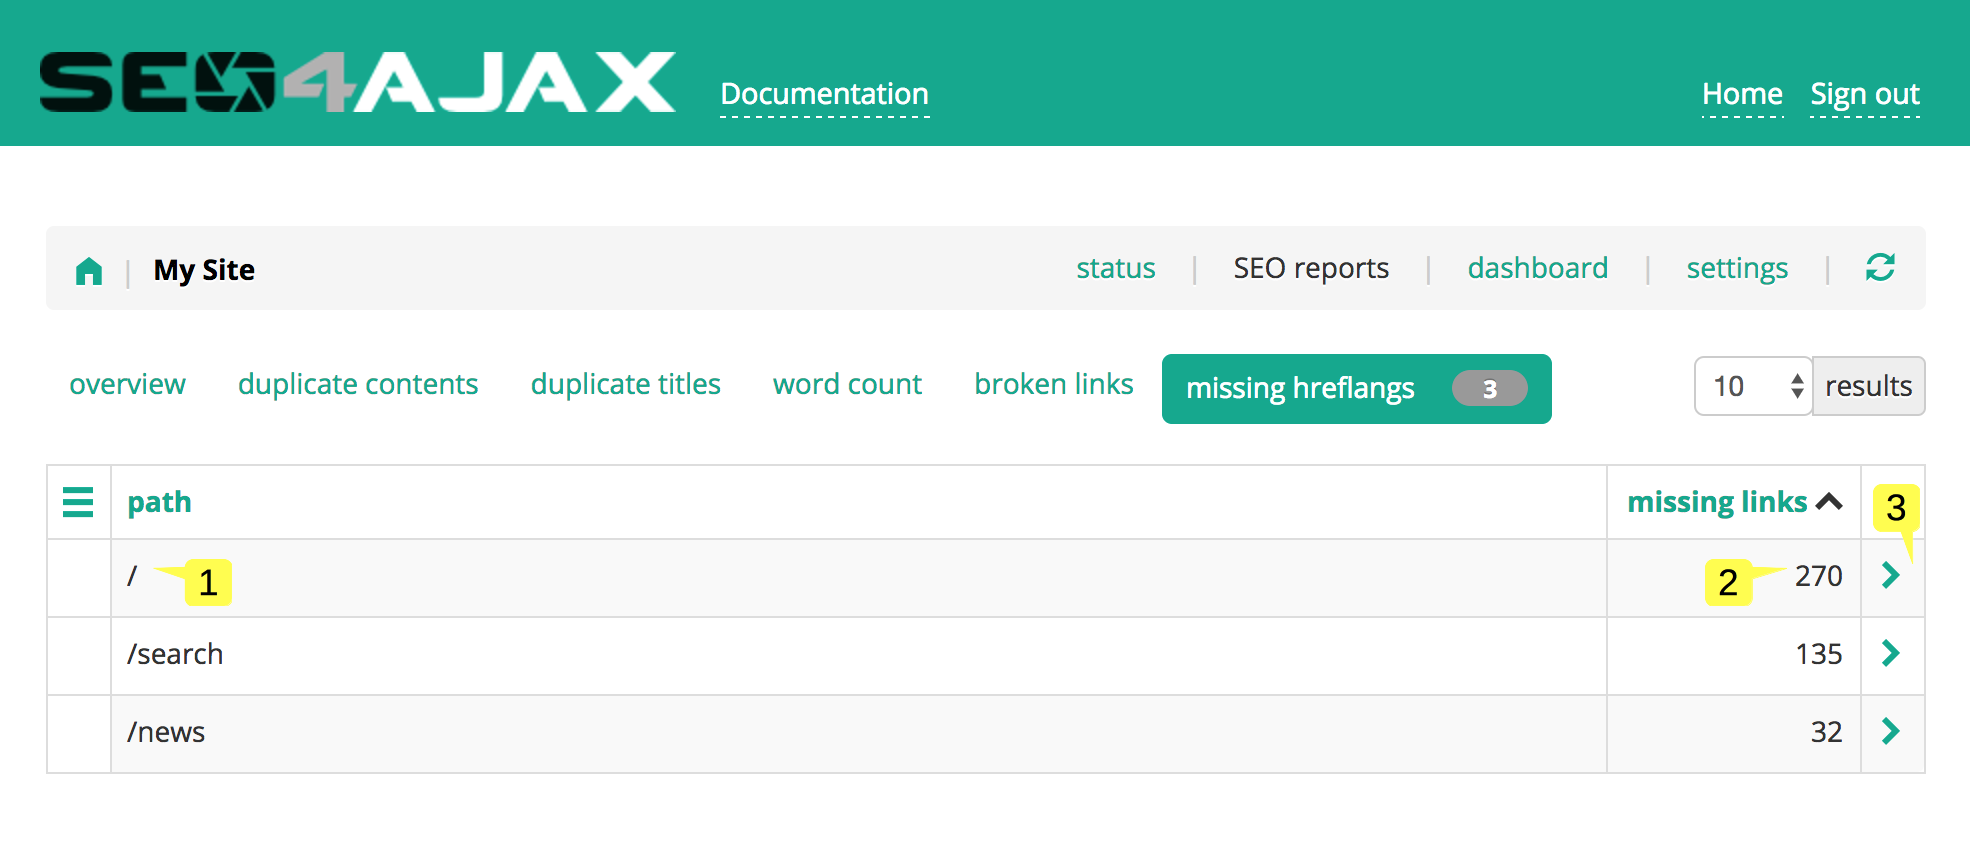
This view lists the pages with missing confirmation links 1 and the number of pages having a hreflang link pointing to them 2. This list of pages with hreflang links is displayed when clicking on the right arrow 3.
Missing hreflang links are often due to:
- Query parameters not taken into account (e.g. /en/home?query=param points to /de/home which points to /en/home)
To fix these issues you may either add the missing confirmation hreflang links on identified pages or remove hreflang links otherwise.
Site dashboard
This page is displayed when you click on the "dashboard" link in the header of the homepage. It allows viewing statistics about website traffic coming from bots.
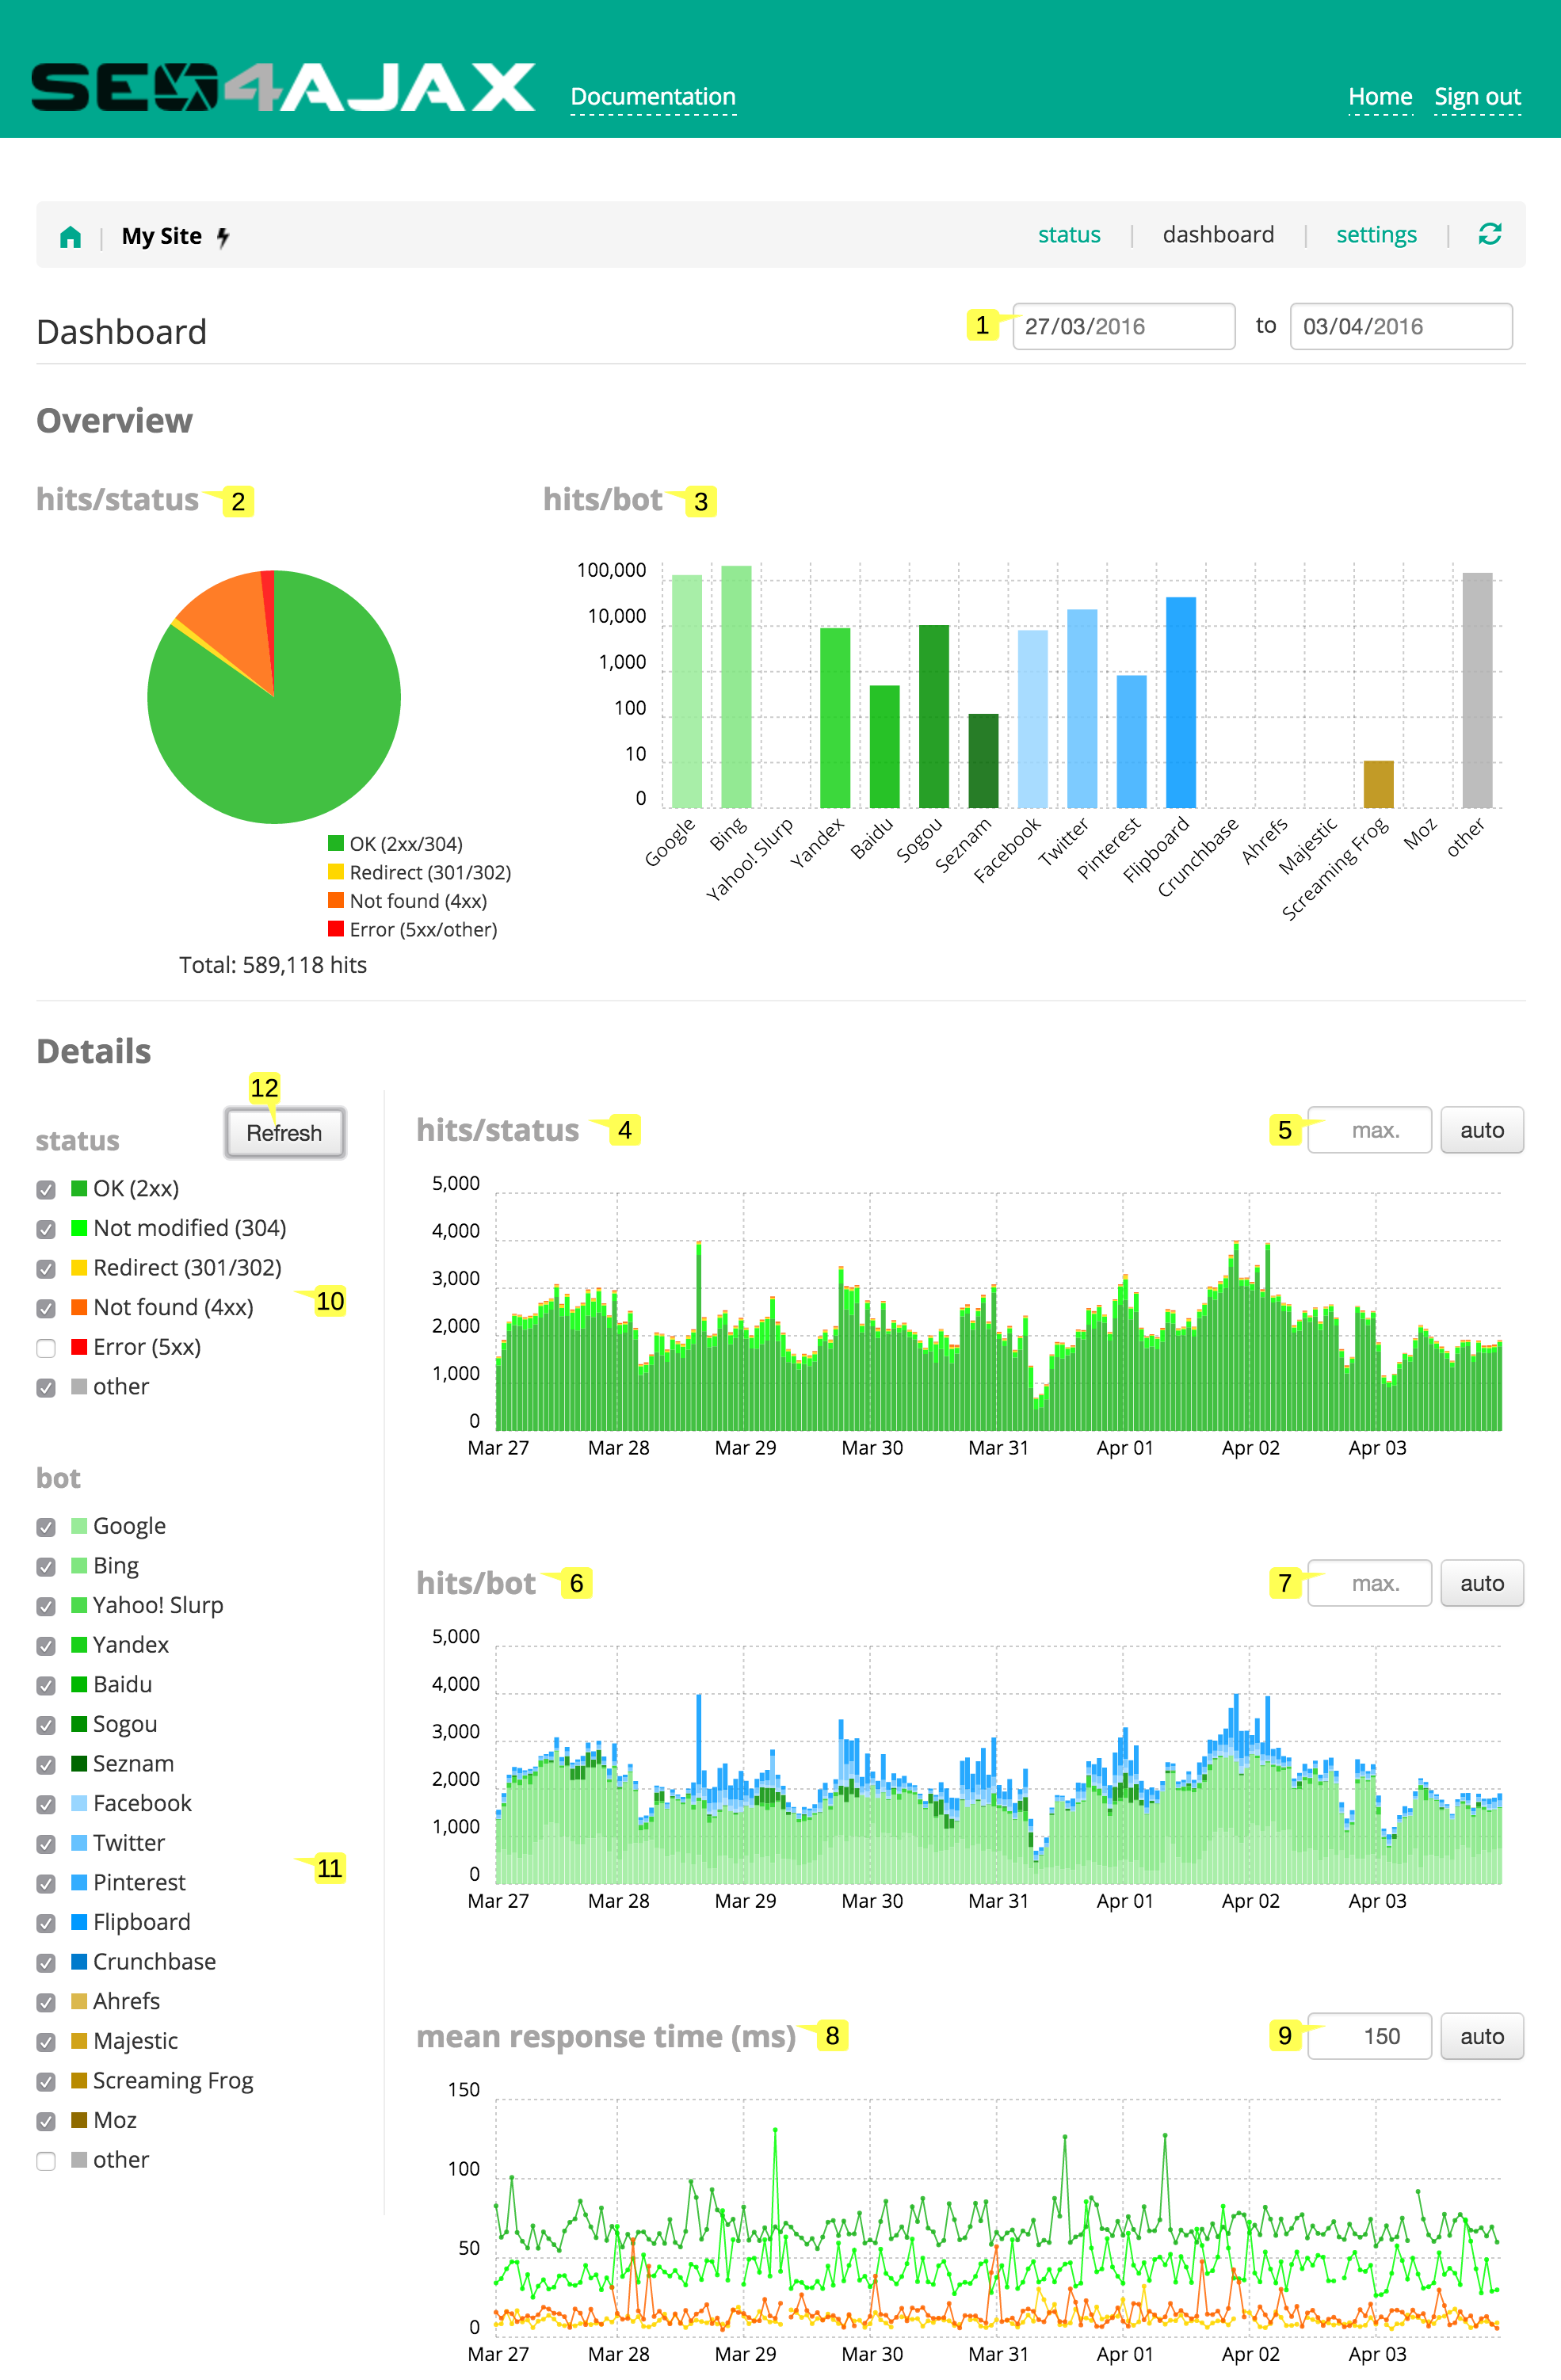
- Type a date period 1 to only display the data for this period
- A pie chart shows the distribution of hits by HTTP status code 2
- A bar chart shows the number of hits by bots 3 (logaritmic scale)
- A bar chart shows the number of hits by HTTP status code 4
- Set the scale of the chart by typing the maximum number of hits allowed to be displayed on the chart 5
- A bar chart shows the number of hits by bots 6
- Set the scale of the chart by typing the maximum number of hits allowed to be displayed on the chart 7
- A line chart shows the mean response time by HTTP status code 8
- Set the scale of the chart by typing the maximum response time allowed to be displayed on the chart 9
- Check the options to filter the HTTP status codes displayed in the detailed charts 10
- Check the options to filter the bots displayed in the detailed charts 11
- Press the "Refresh" button to apply the filters 12
Site settings
This page is displayed when you click on the "settings" link in the header links. It allows configuring options of the crawler.
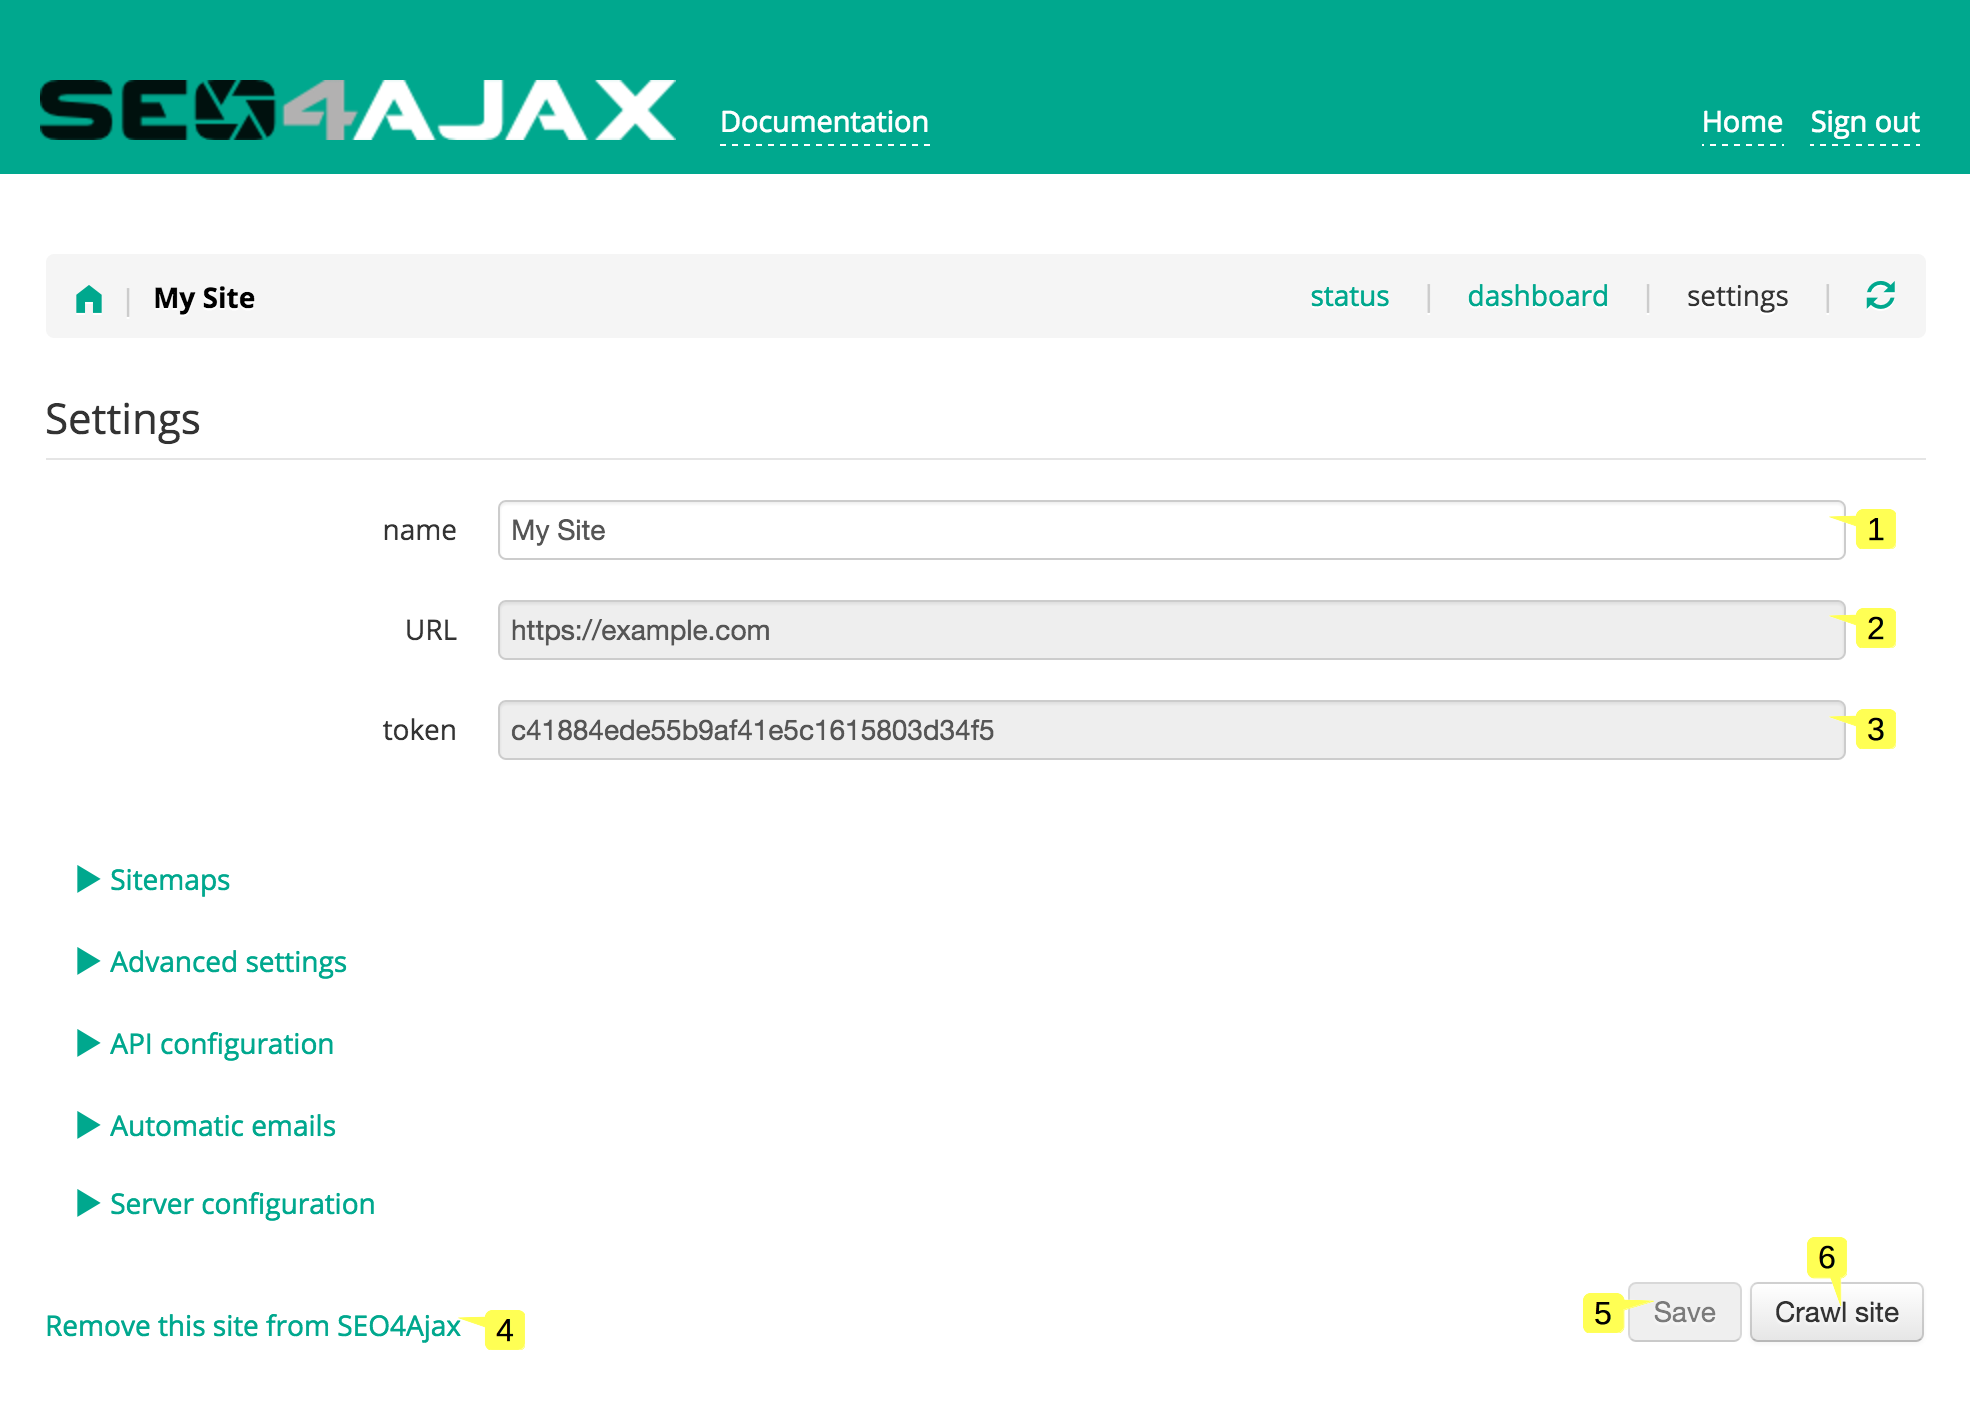
- The site name 1 will be displayed in the Home page and in the header of the Site status page
- The site URL 2 is read-only
- The site token is read-only 3, it is used to get captures through the SEO4Ajax public API
- Click on the "Remove this site from SEO4Ajax" link 4 to open the Remove site popup
- Press the "Save" button 5 to save the current configuration, the button is active only if something changed since the last save
- Press the "Crawl site" button 6 to crawl the site
Sitemaps
This panel is displayed when you click on the "Sitemaps" title. It allows configuring the sitemap URLs of the site.
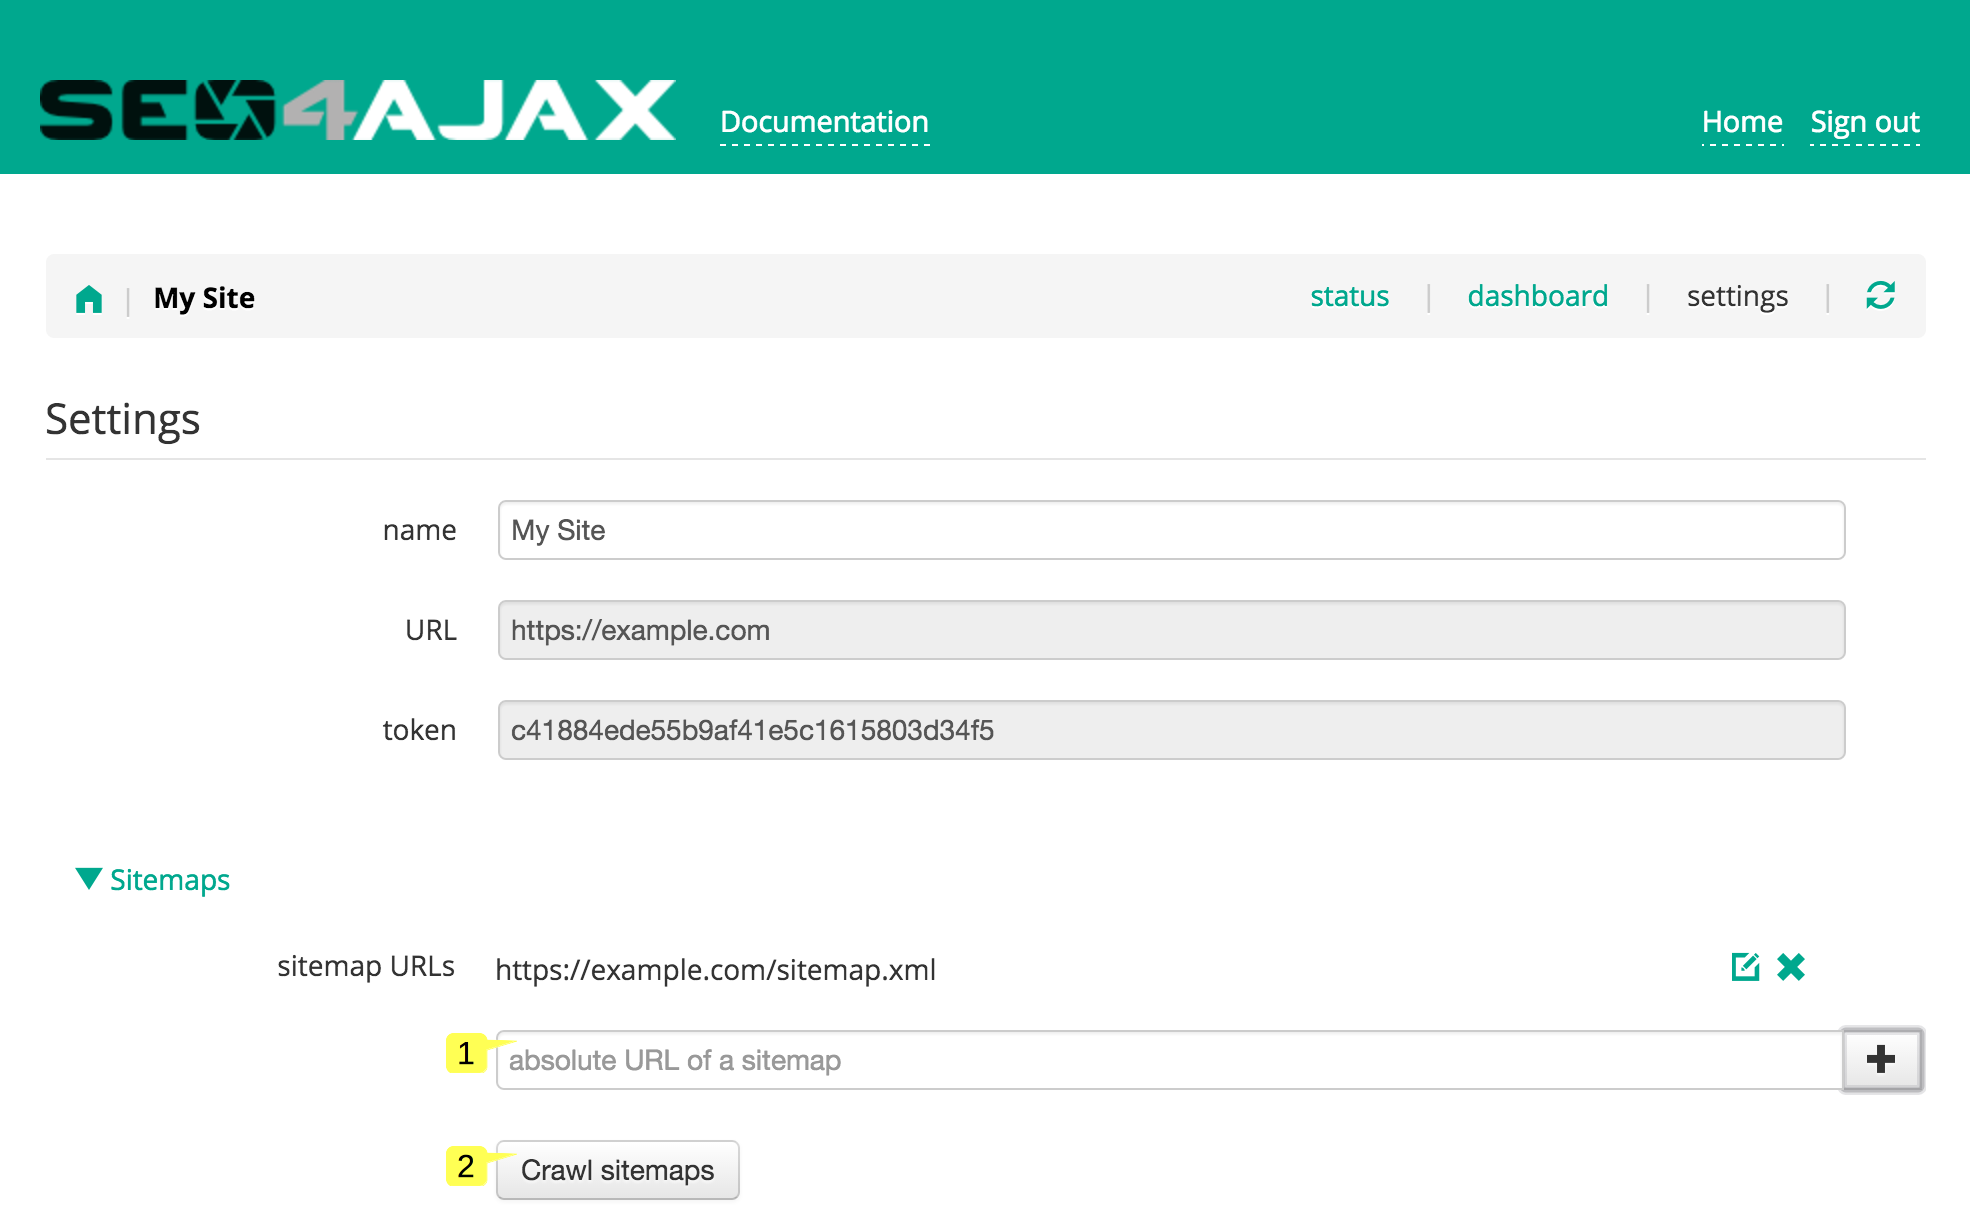
- Type a sitemap URL 1, it can point to a simple sitemap file or a sitemap index file
- Press the "Crawl sitemaps" button 2 to launch immediately the crawl of the sitemap(s)
The crawler supports lastmod and changefreq tags in order to define more accurately when the pages should be captured. If these tags are not defined or contain invalid values then the settings of the API configuration are applied.
Advanced settings
This panel is displayed when you click on the "Advanced settings" title. It allows configuring options related to the capture process.
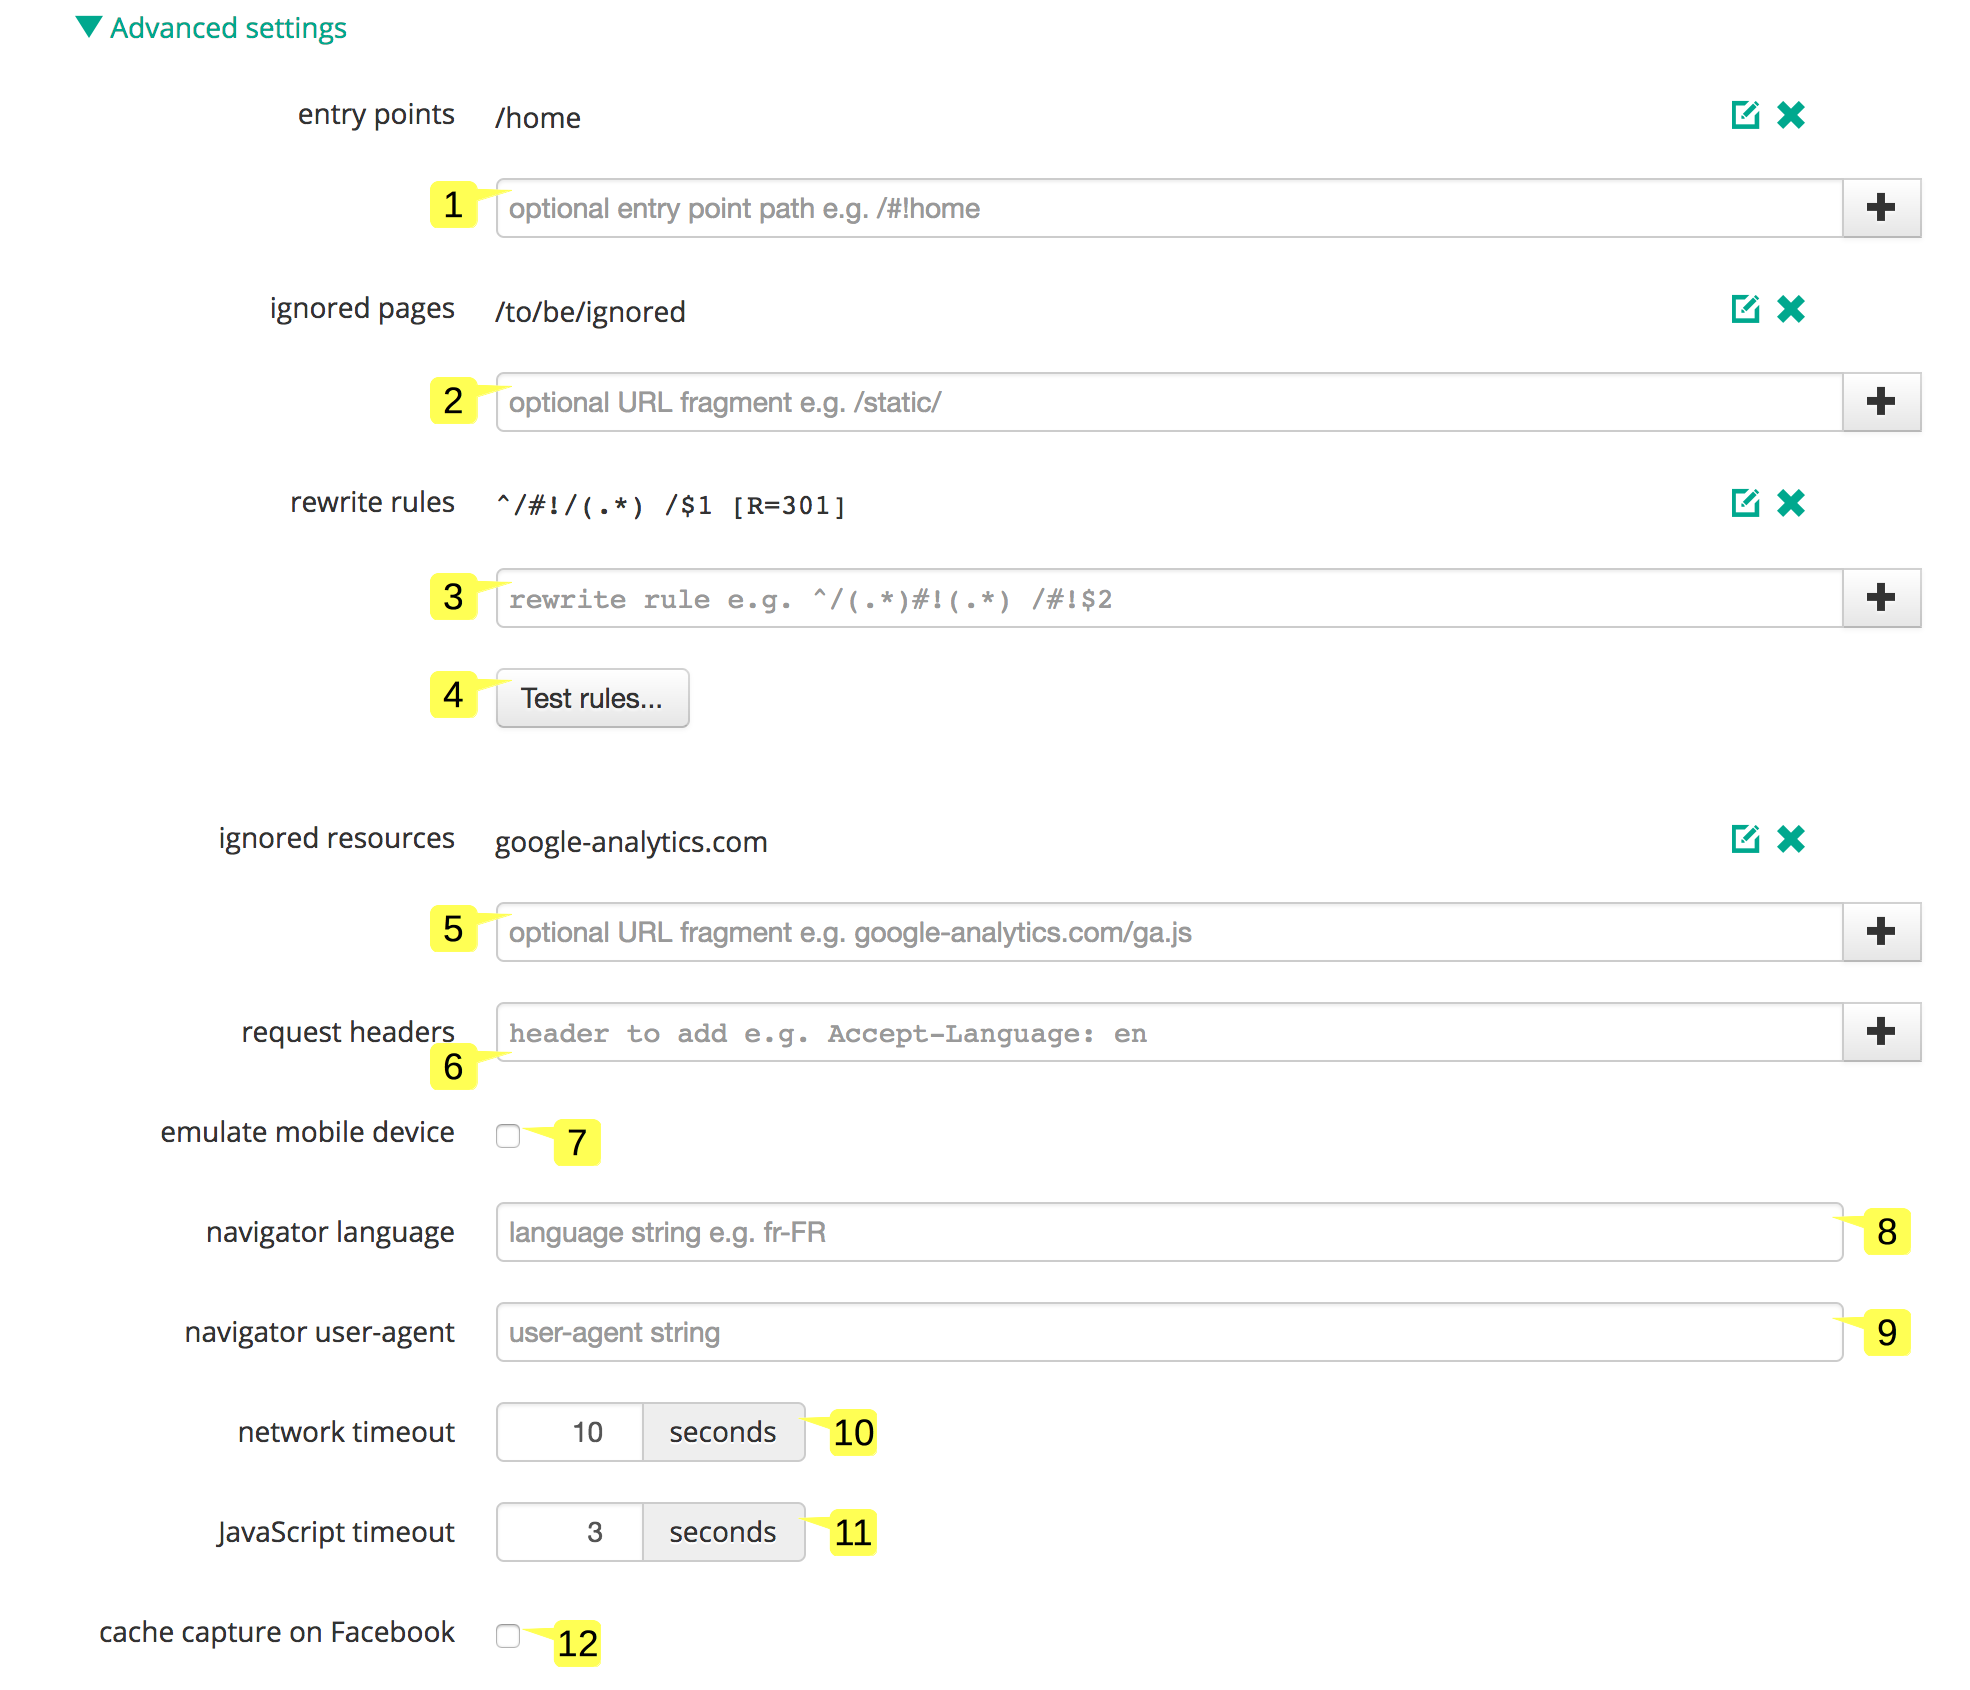
- Type the entry points 1 of the site, you should add paths that will help the crawler to find pages to capture (e.g. paths which are not accessible through inner links) or paths that you want to capture more than once per day (e.g. HTML sitemaps)
- Type the paths 2 you don't want to capture (e.g. "static/" without the quotes), the public API will return a 404 for these paths
- Type the rewrite rules 3 to rewrite paths or to control HTTP codes, "normalize" paths, define invalid paths or manage redirects... You can find more information here
- Press the "Test rules..." button 4 to open the Test rewrite rules popup
- Type the URLs (or URL fragment) 5 of resources (i.e. CSS or JavaScript files) you want to block when capturing pages (e.g. "ad.js", "tracker", "/social/button.js" without the quotes)
- Type the HTTP headers 6 the crawler should add on every request it makes when capturing a page
- Check the "emulate mobile device" option 7 if you want the crawler to emulate a mobile device when capturing pages
- Type the language 8 the crawler should expose through JavaScript API in the browser when capturing a page
- Type the user agent string 9 used by the SEO4Ajaxcrawler, the default value is "Mozilla/5.0 AppleWebKit (compatible; s4a/1.0; +https://www.seo4ajax.com/webscraper)" without the quotes
- Define a maximum delay 10 allowed by the crawler to request resources (i.e. CSS, JavaScript files, Ajax contents) when capturing a page
- Define a maximum delay 11 allowed by the crawler to execute the JavaScript code once all resources are received
- Check the "cache capture on Facebook" option 12 if you want the crawler to automatically update the Facebook cache when a new page is captured
API configuration
This panel is displayed when you click on the "API settings" title. It allows configuring options related to the public API behavior and the default authenticated API behavior.
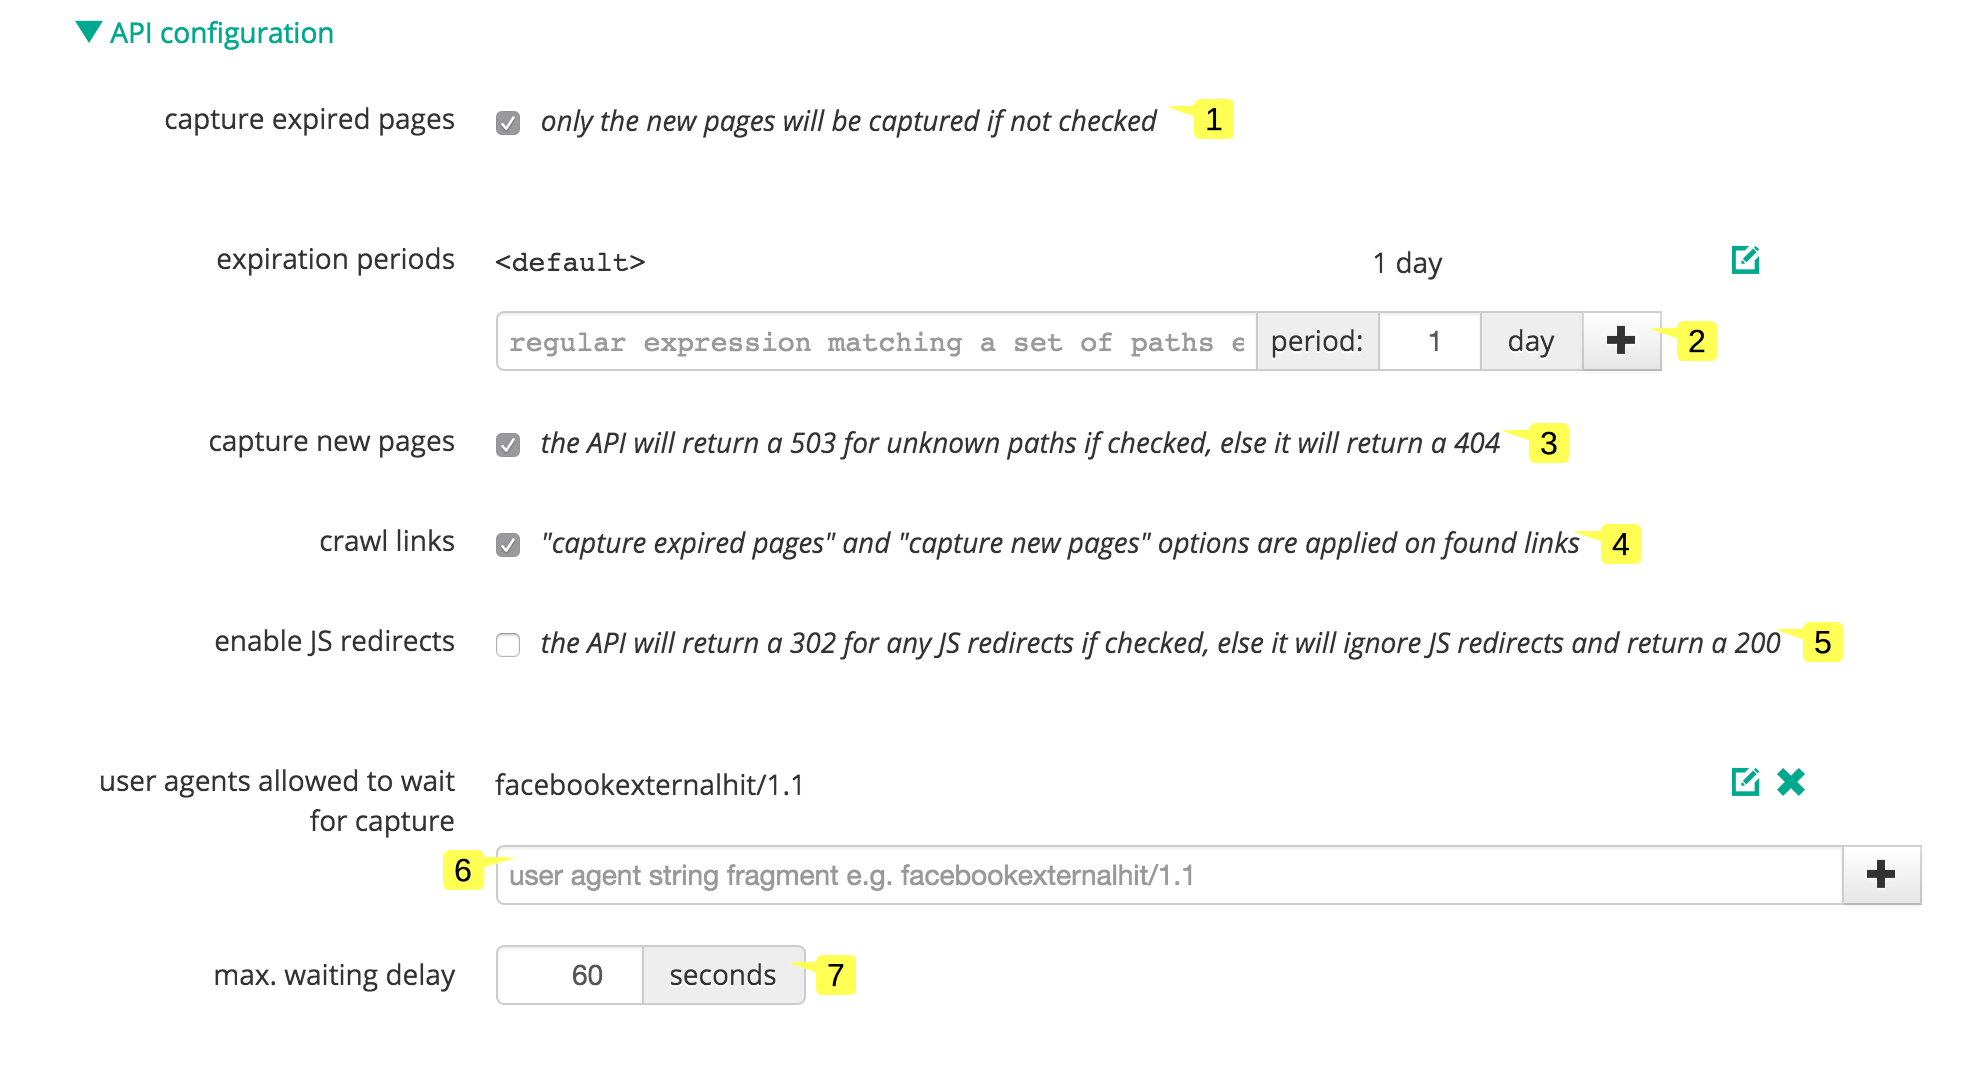
- Check the "capture expired pages" option 1 to automatically re-capture pages when they are expired
- Type a regular expression matching paths and an associated expiration period 2
- Check the "capture new pages" option 3 to automatically capture unknown paths
- Check the "crawl links" option 4 to crawl the inner links found in the captured pages
- Check the "enable JS redirects" option 5 if you want the crawler to detect JavaScript redirects, and optionnaly select the status code returned to bots when the option "enable JS redirects" is enabled
- Type the bot user-agent fragments 6 to enable on the fly captures
- Type a maximum delay 7 allowed for the on the fly captures
The "capture expired pages", "page expiration period", "capture new pages" and "crawl links" settings is also applied when crawling the site.
If you uncheck "capture expired pages", "capture new pages" and "crawl links" options, then the public API calls will never trigger a capture.
If you check the "crawl links" option, then the "capture expired pages" and "capture new pages" options are applied to inner links.
Automatic emails
This panel is displayed when you click on the "Automatic emails" title. It allows defining emails that should be automatically sent.
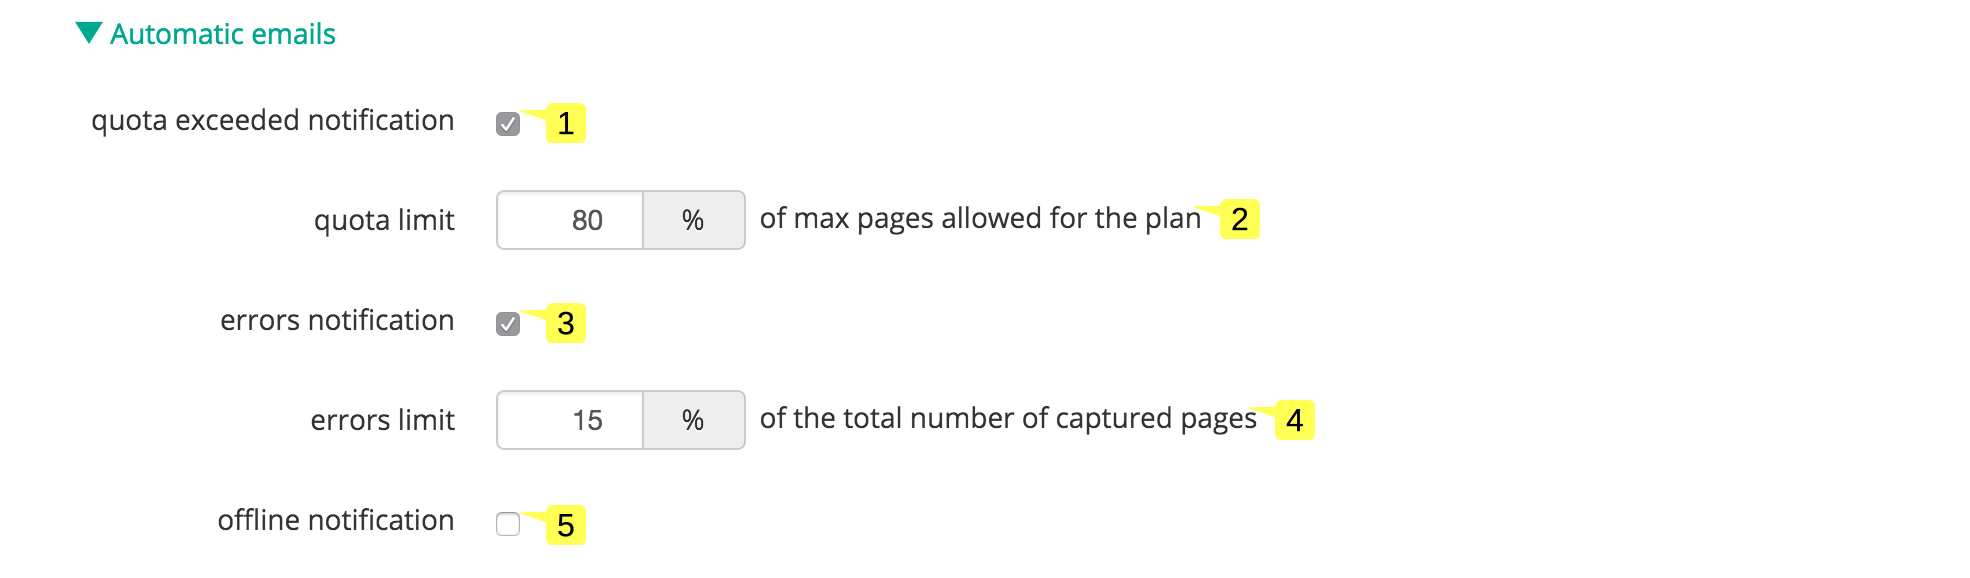
- Check the "quota exceeded notification" option 1 to receive a daily email when a certain quota of captured pages (vs. the maximum allowed for the plan) has been reached
- Type a quota limit 2 in percentage, when this limit is reached the email is sent
- Check the "errors notification" option 3 to receive an email when a certain quota of captures in error has been reached
- Type a quota limit 4 in percentage, when this limit is reached the email is sent
- Check the "offline notification" option 5 to receive an email when the site is no more connected to the public API
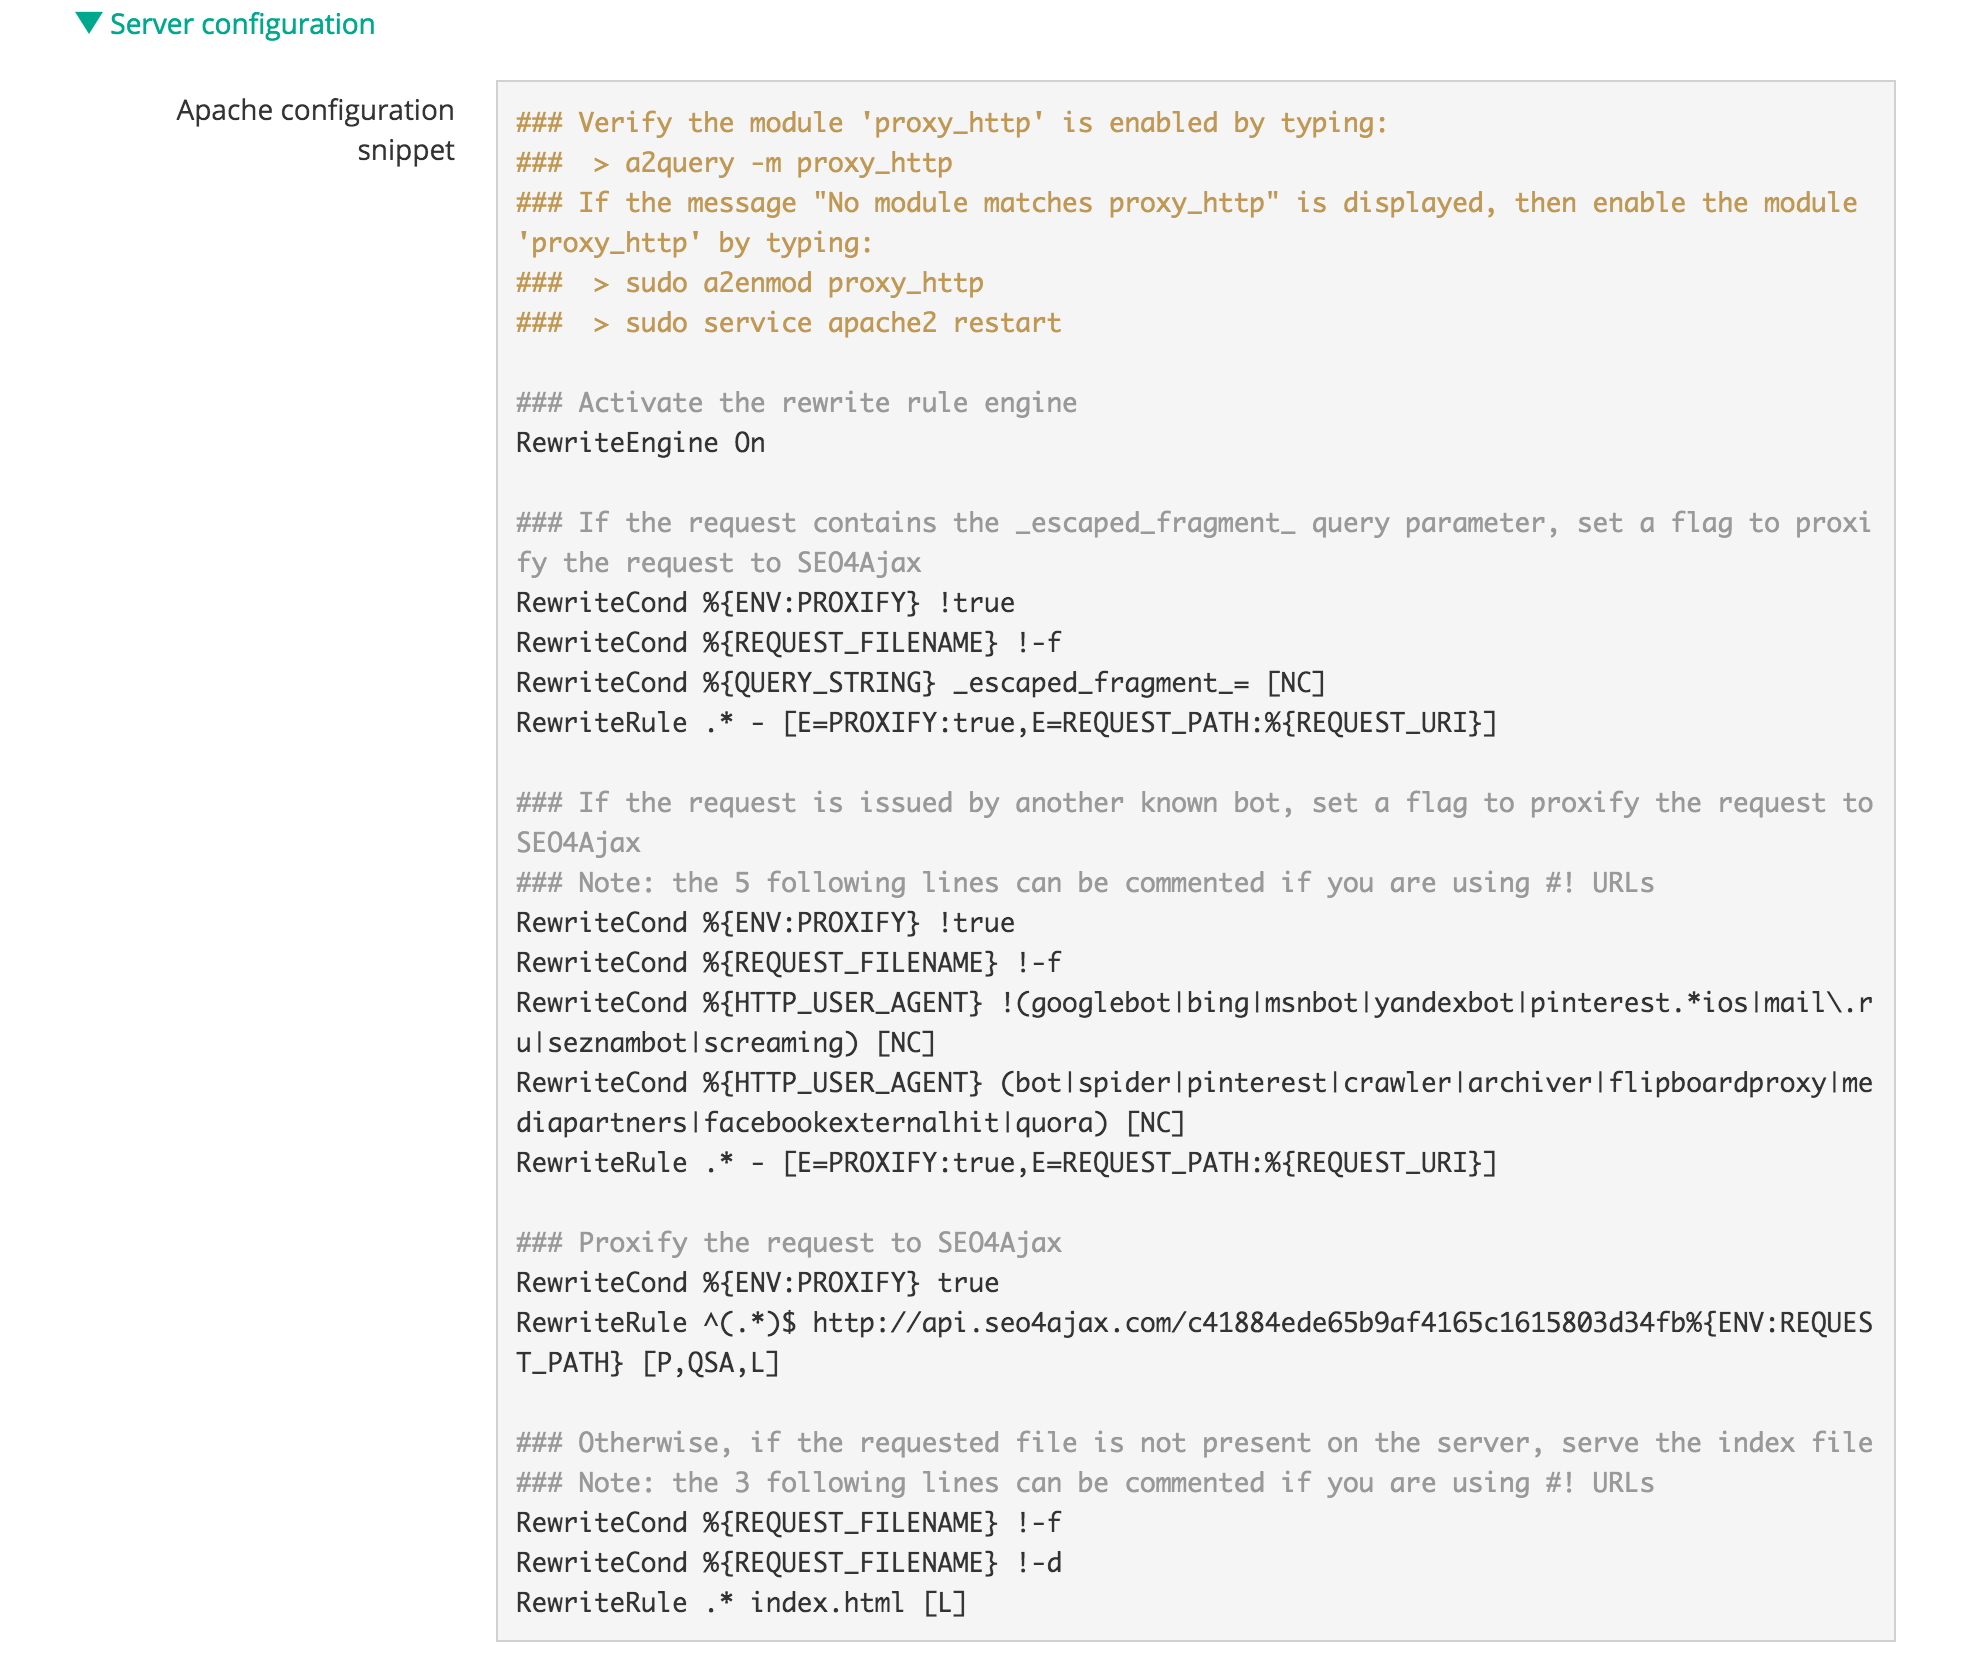
Server configuration
This panel is displayed when you click on the "Server configuration" title. It allows displaying Apache, Nginx and IIS configuration snippets which can be used to connect your HTTP server with the public API.
Rewrite rules popup
This popup is displayed when you press the "Test rules..." button in the Advanced panel. It allows testing the rewrite rules you defined.
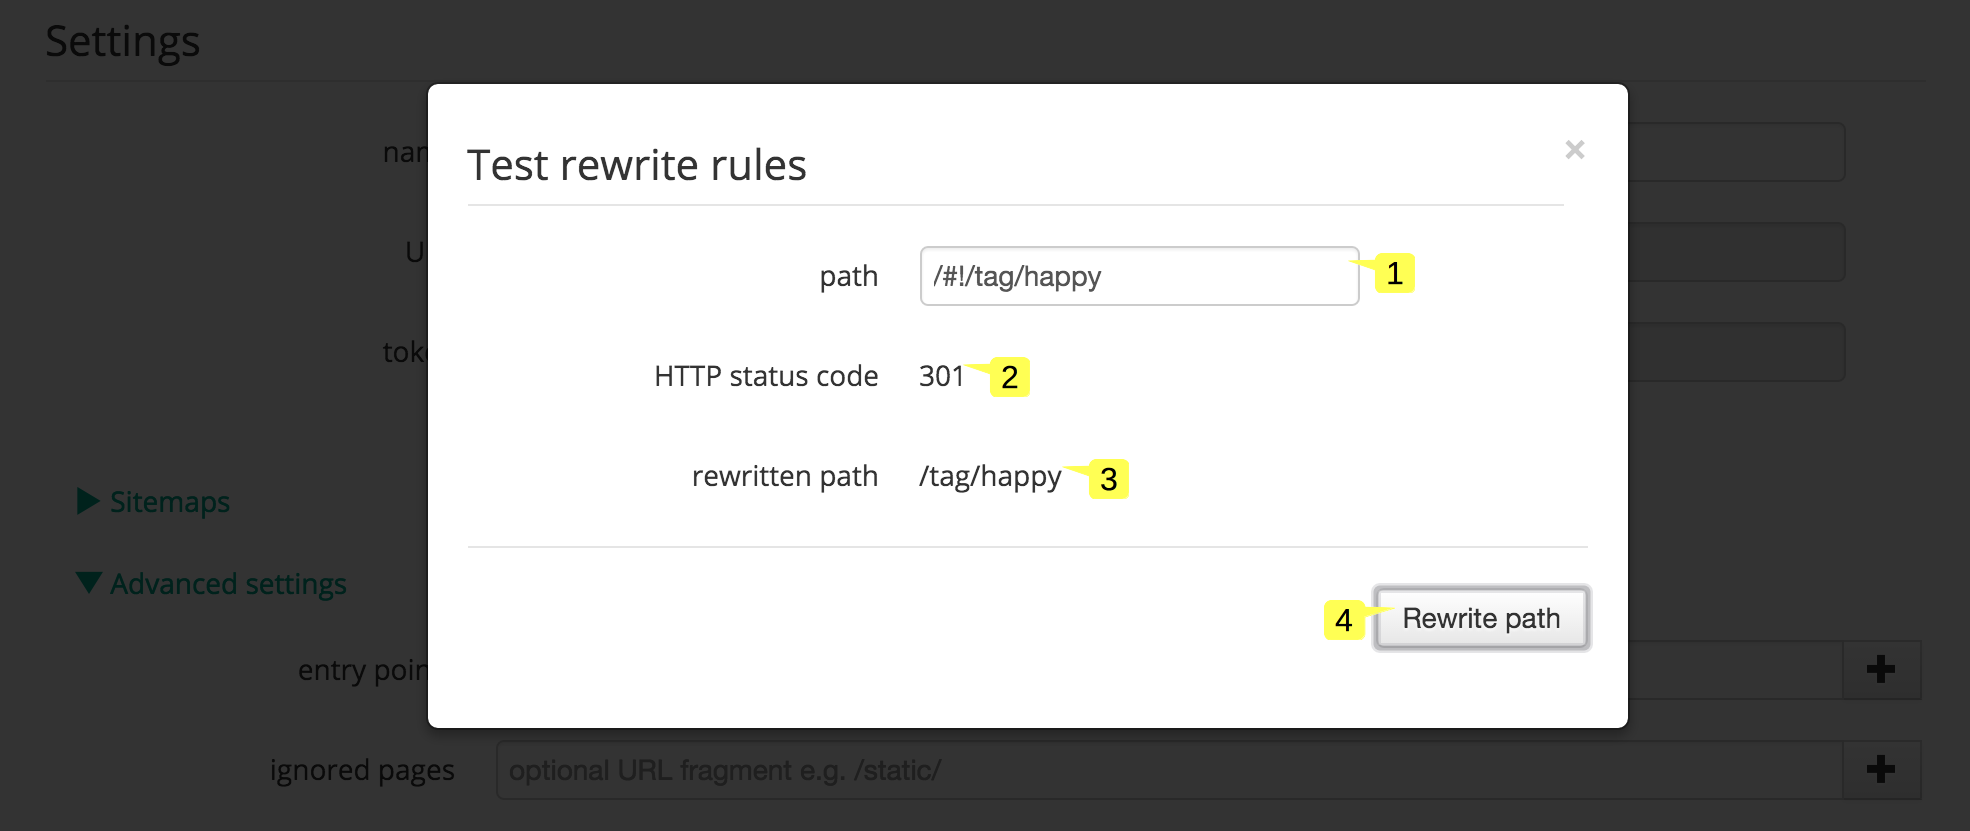
- Type a path 1 to test
- Press the "Rewrite path" button 4 to compute the HTTP code 2 and the rewritten path 3 according to the rewrite rules
Remove site popup
This popup is displayed when you click on the "Remove site from SEO4Ajax" link in the Site settings page.
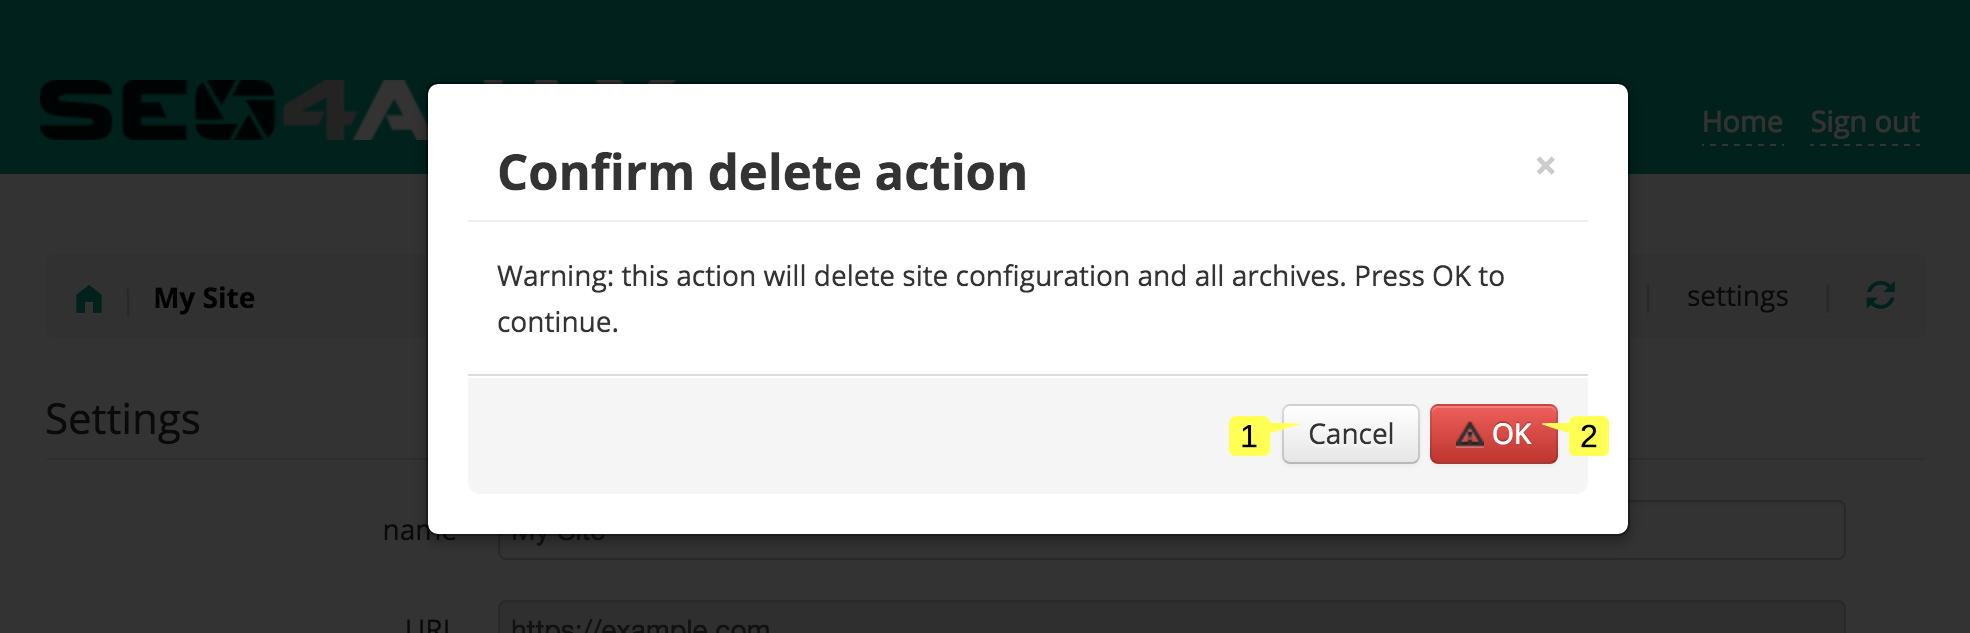
- Press the "Cancel" button 1 to cancel the action and close the popup
- Press the "Confirm" button 2 to confirm the action